Edgartown Great Pond’s Long-Awaited Opening
Edgartown Great Pond March 2026 Cut Story
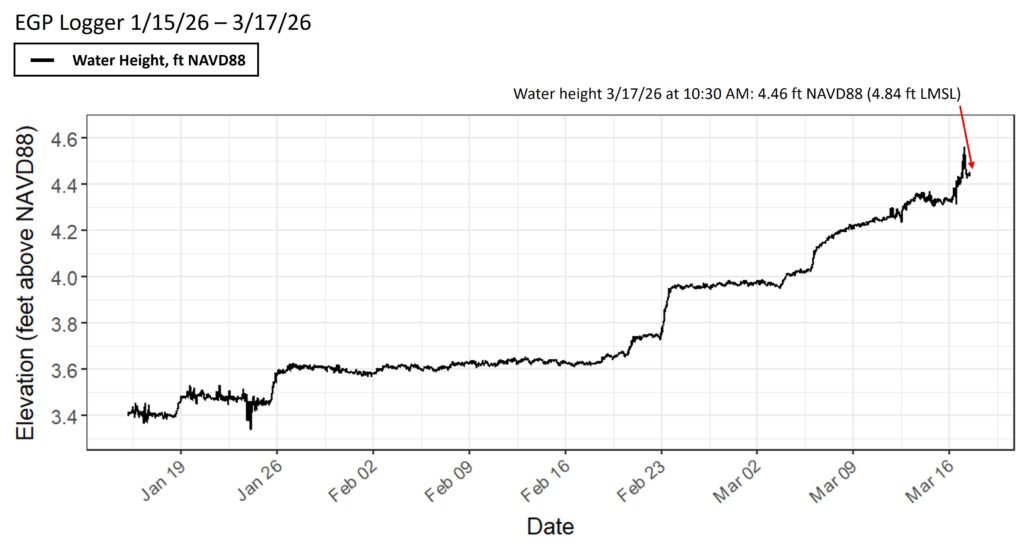
The Cut Begins
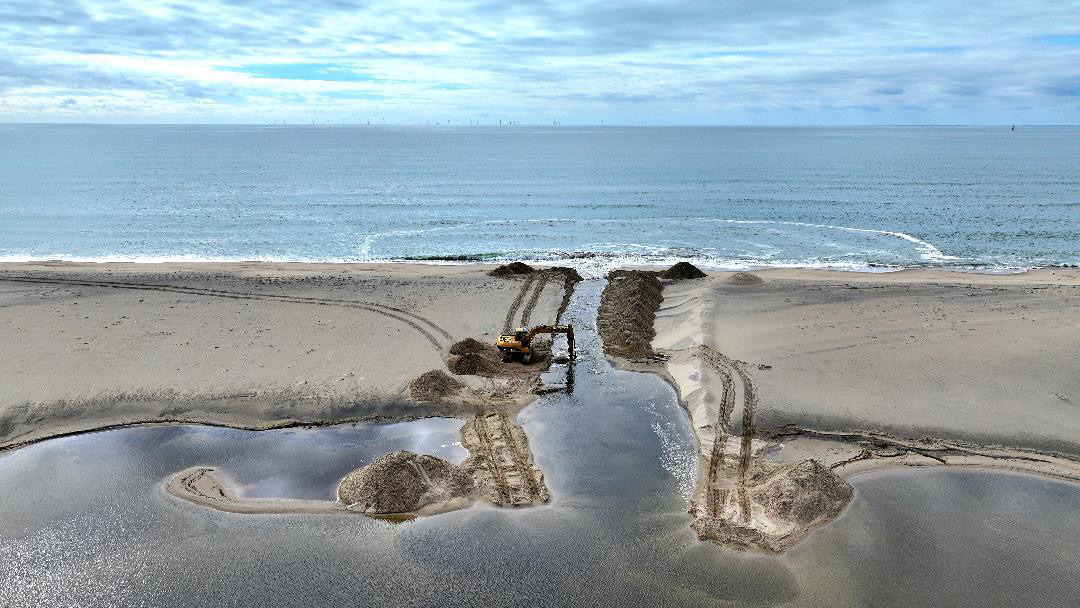
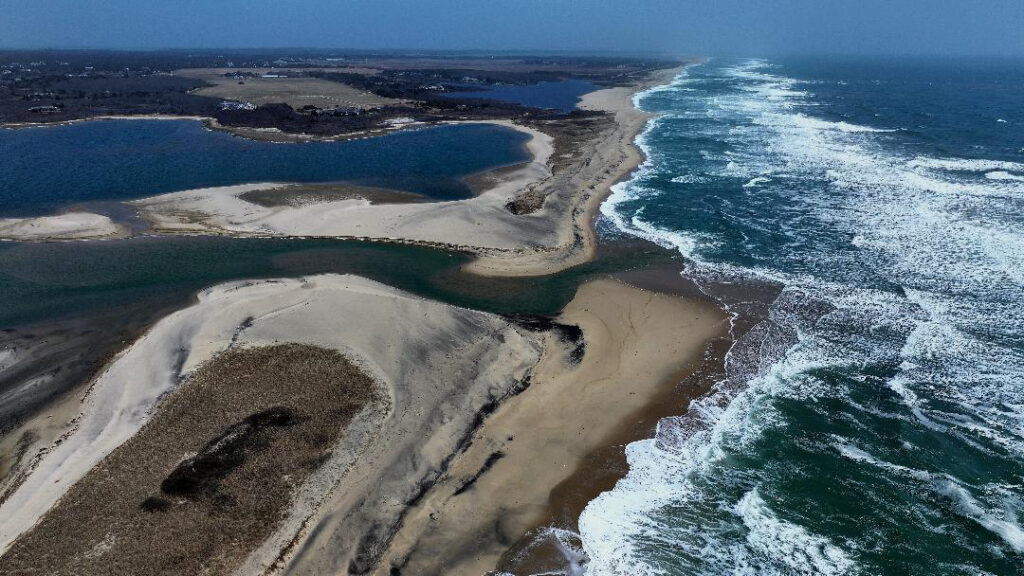
The town of Edgartown opened Edgartown Great Pond (EGP) to the Atlantic Ocean on the morning of Thursday, March 19th (Photo 1), marking a highly anticipated moment for the community. Using an excavator, town crews breached the barrier beach, carving a narrow channel connecting the Pond with the open ocean. Immediately following the cut, pond water surges towards the sea through the channel, initiating the drainage phase and steadily lowering the Pond’s water elevation. As this strong outgoing flow continues, the channel naturally widens and deepens, allowing even greater volumes of water to pass through.
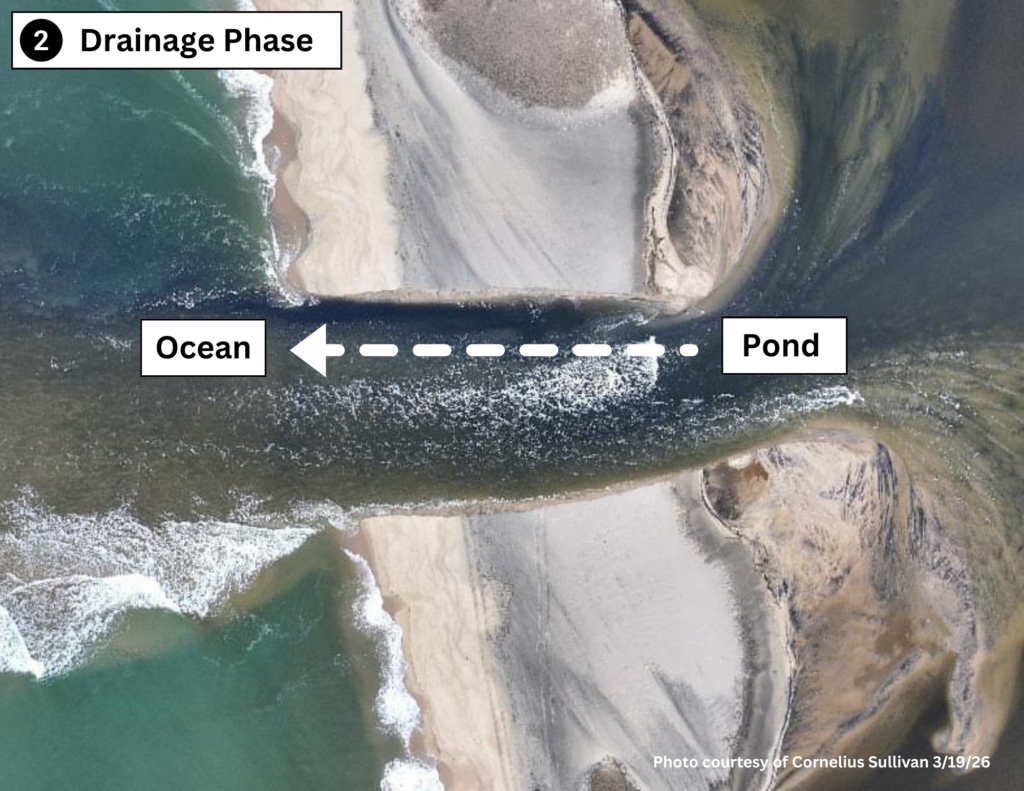
Once the initial drainage stage is complete, the Pond transitions into the tidal phase. Regular tidal exchange between the ocean and the Pond is established, allowing cool, clean, salty ocean water to flow in with each incoming tide, while nutrient‑rich pond water is flushed out to sea. This exchange is a key process in restoring and maintaining overall water quality within the Pond.
Why Cut The Pond?
Lower Water Elevation & Mitigate Flooding
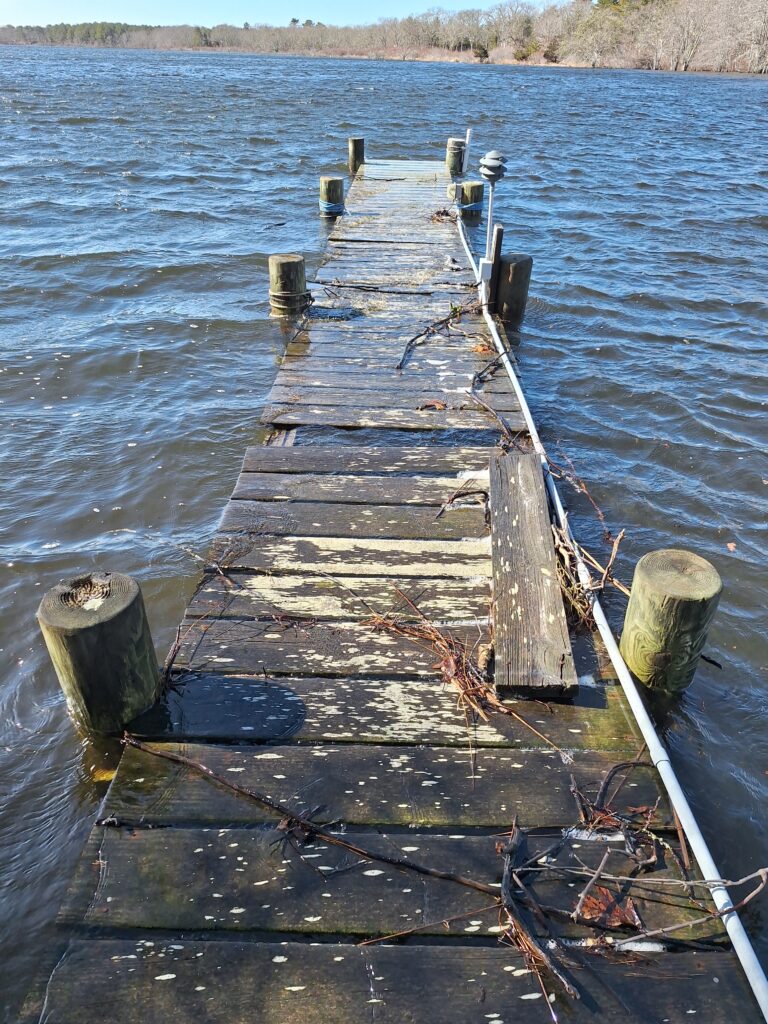
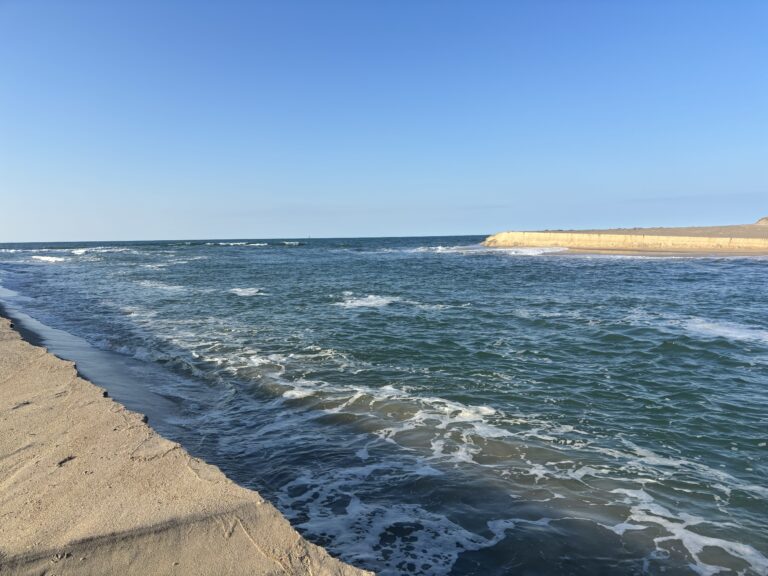
Pond cuts play a critical role in managing elevated water levels and reducing the risk of flooding in surrounding areas. When water levels rise too high infrastructure (Photo 2), and fragile shoreline habitats become threatened.
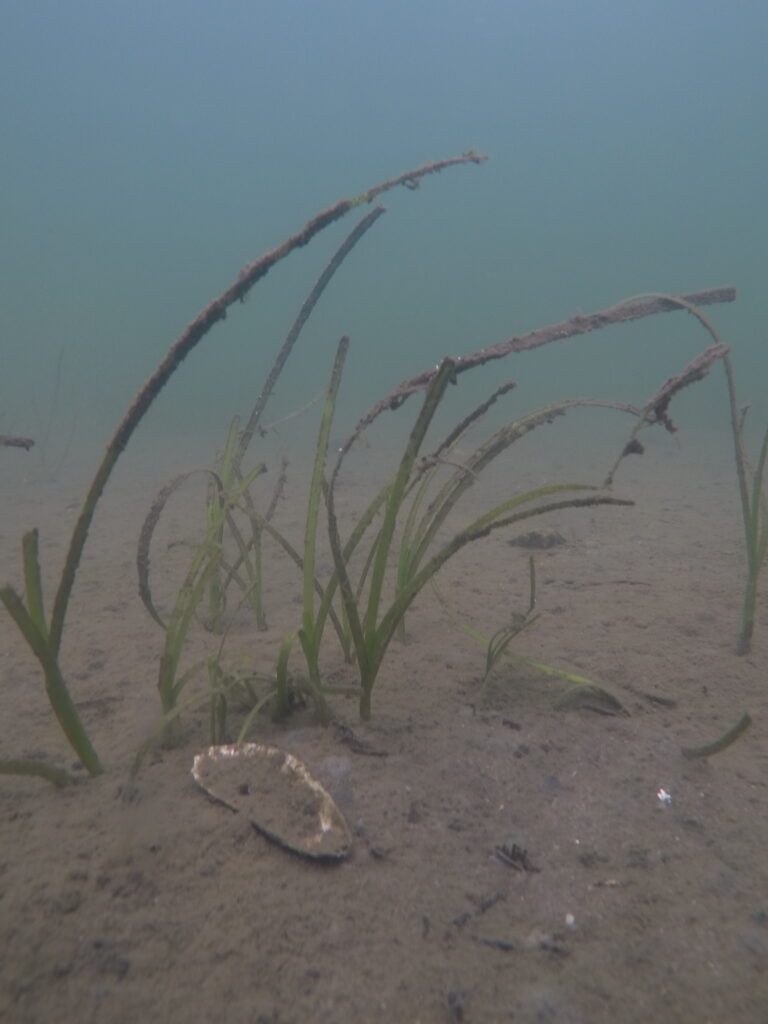
Sustain Eelgrass Communities
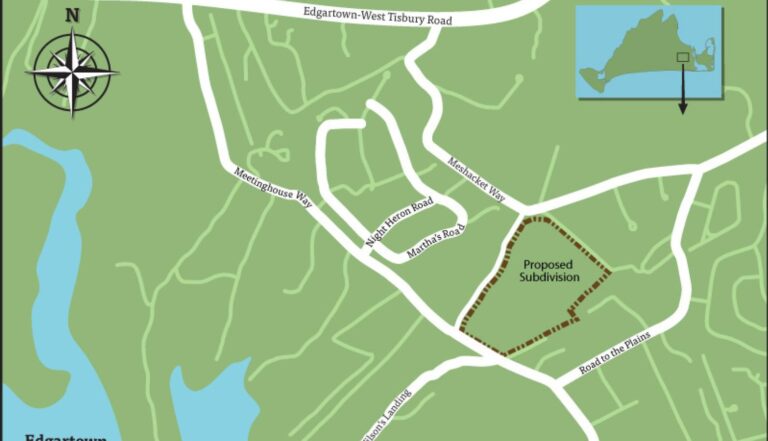
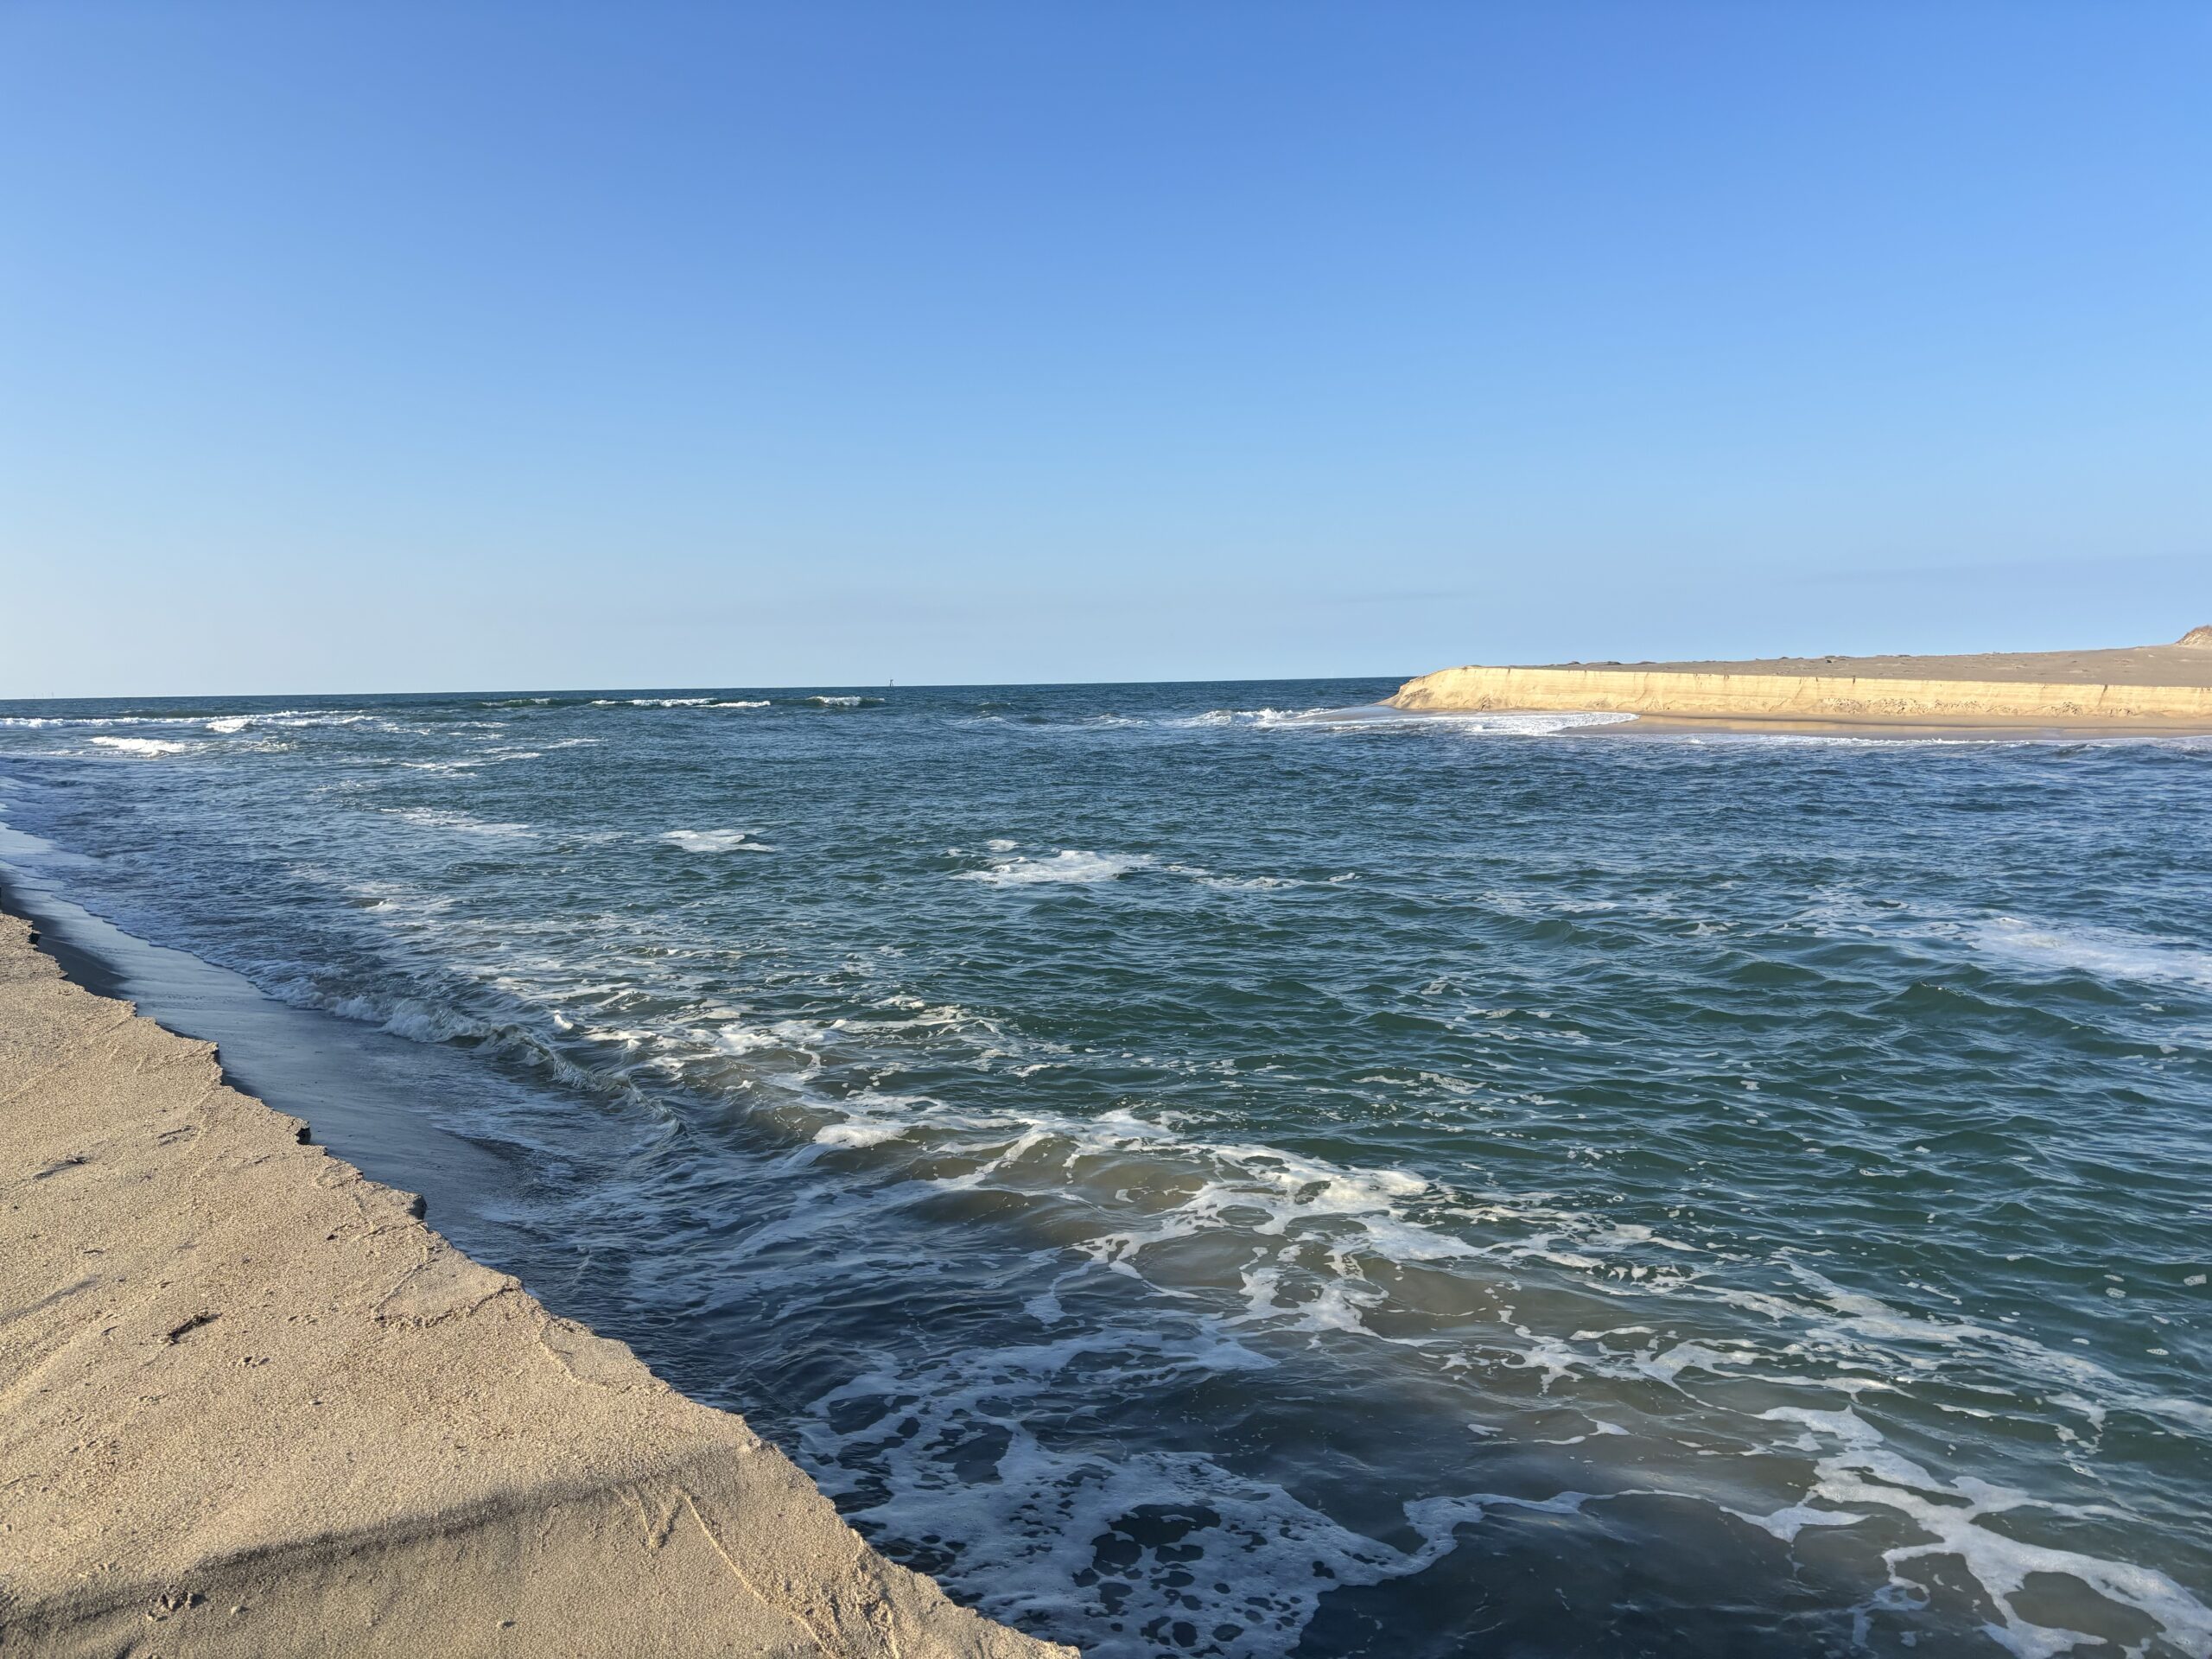
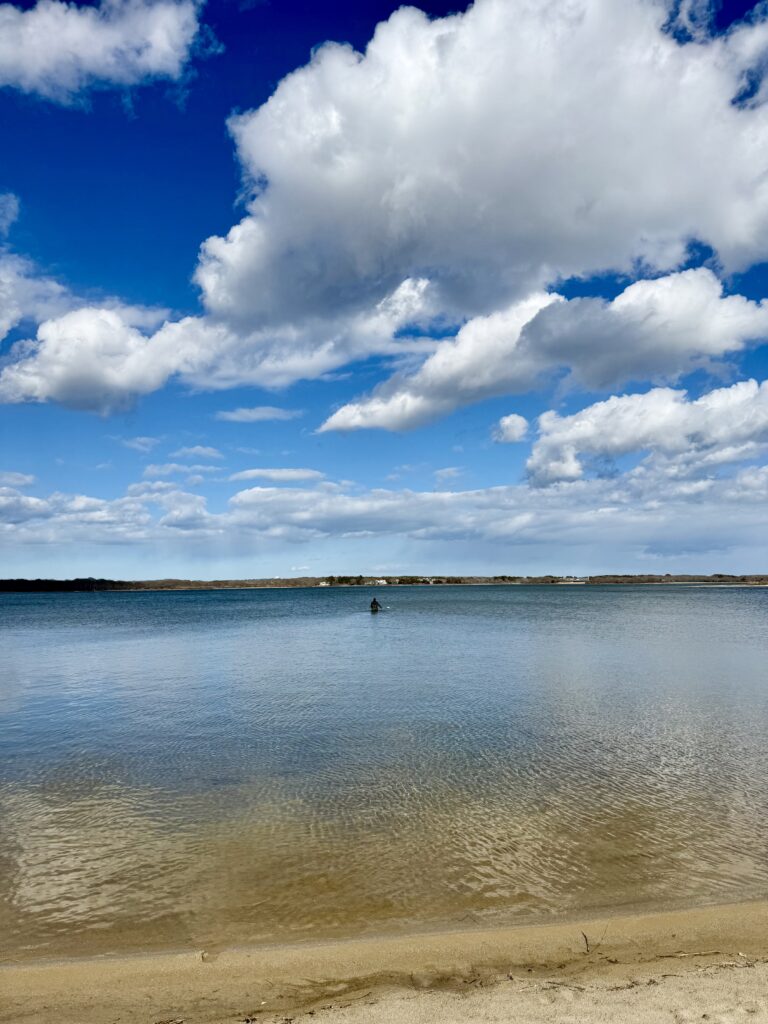
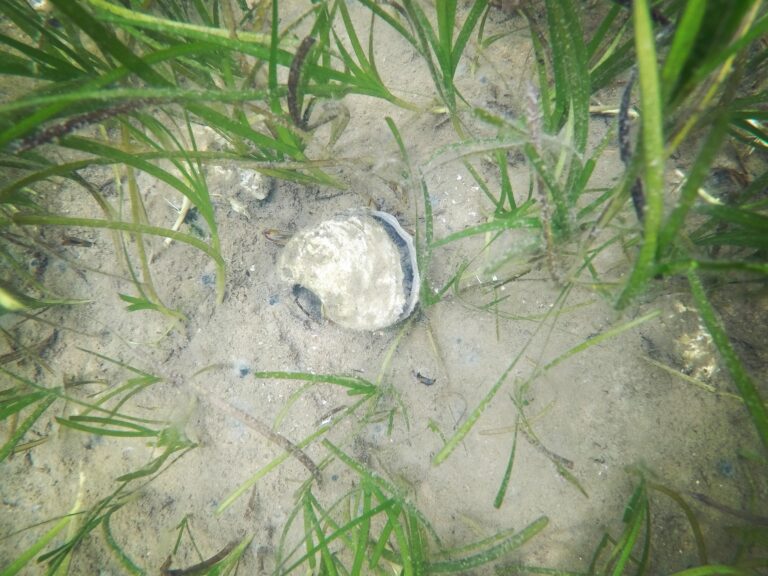
Beyond flood mitigation, tidal exchange is essential to the health of the Pond’s ecosystem. Connecting the Pond to the ocean increases salinity levels, which is vital for supporting eelgrass habitats. Eelgrass requires salinity levels above approximately 15 parts per thousand (ppt) to survive. For your reference, 0 ppt is freshwater and 34–36 ppt is ocean water. These intentional openings to the ocean are therefore integral to sustaining eelgrass communities (Photo 3).
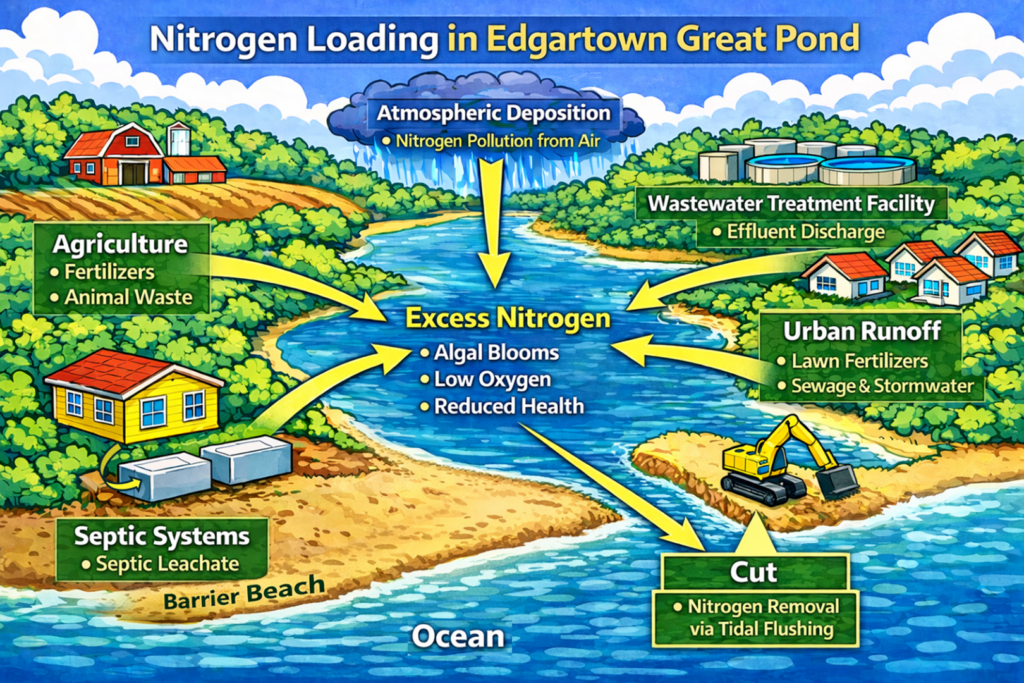
Nitrogen Release Valve
Excess nitrogen in EGP leads to reduced ecosystem health possibly leading to more frequent algal blooms and low oxygen. “The 3 main external sources of nitrogen to the Island’s coastal ponds are wastewater, fertilizers, and atmospheric deposition. Findings from a 2021 study published by GPF and the Marine Biological Laboratory revealed wastewater as the leading source of external nitrogen to EGP, followed by fertilizer runoff (Lloret et al., 2021).” Owen Porterfield, 2025 EGP Ecosystem Monitoring Report (Photo 4).
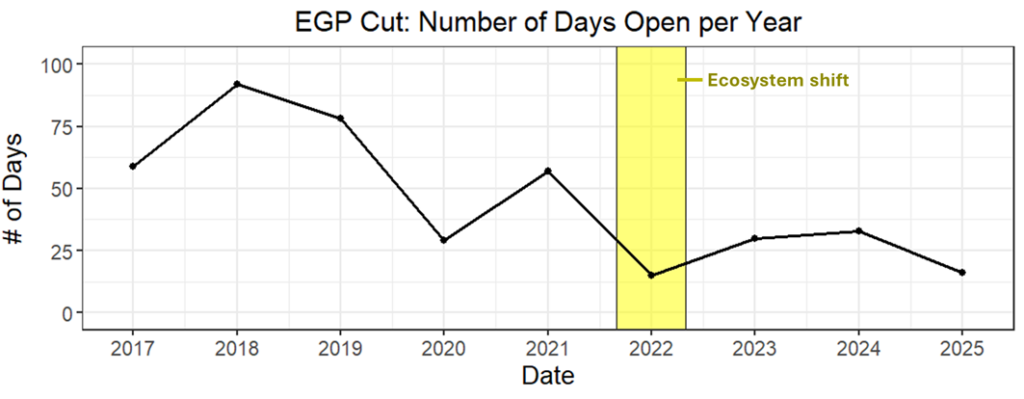
Pond cuts act as a “release valve” for excess nitrogen in the Pond. The Pond’s periodic cuts help flush excess nitrogen further improving water quality and supporting long‑term ecological resilience. Cuts are essential to the health of the ecosystem but cannot always be relied upon as the only tool to combat nitrogen pollution. Cuts are only possible when the Pond is high enough (at least 3.5 ft above local mean sea level) which means cuts typically only happen 3-4 times a year as precipitation is needed for recharge which generally takes several months of rainfall. “Since 2022, the EGP cut has generally remained open for fewer days each year relative to years falling before 2022″(Owen Porterfield, 2025 EGP Ecosystem Monitoring Report) (Figure 1). It’s also important to note that the amount of nitrogen a cut removes from EGP depends on how long the cut stays open. An ideal cut opening is 9-11 days; this however cannot be controlled and is up to the hands of nature.
Want to read more about EGP’s water quality? Check out our past EGP Ecosystems Monitoring Reports. The 2025 EGP Ecosystem Monitoring Report is currently not released yet but will be soon… Stay tuned!
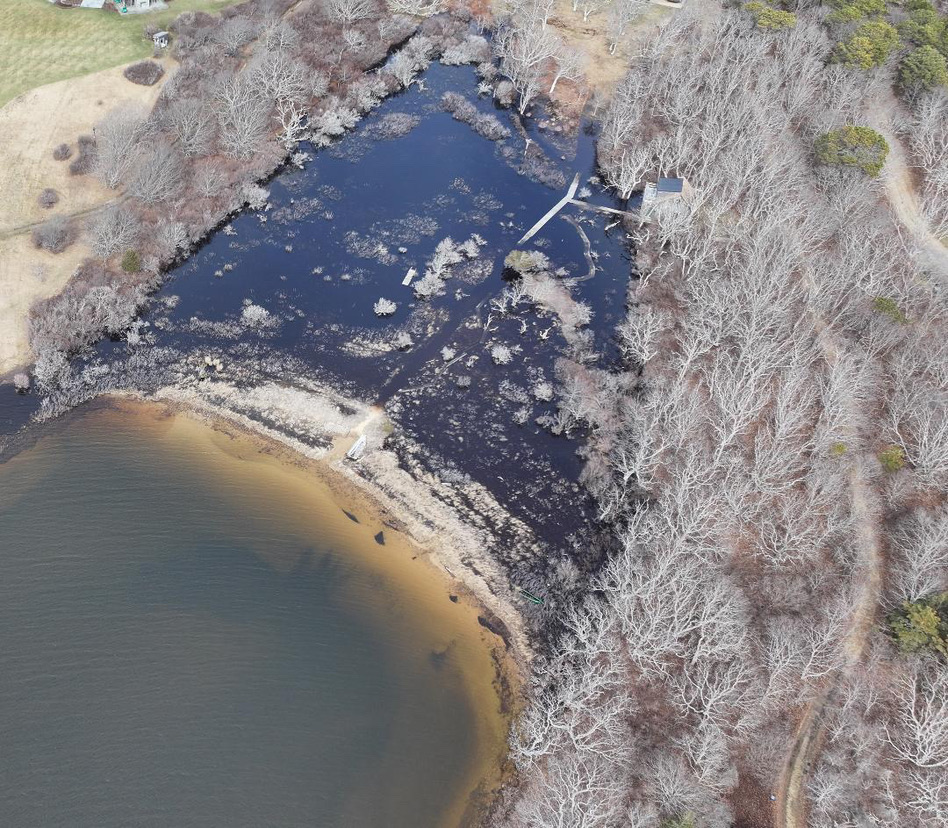
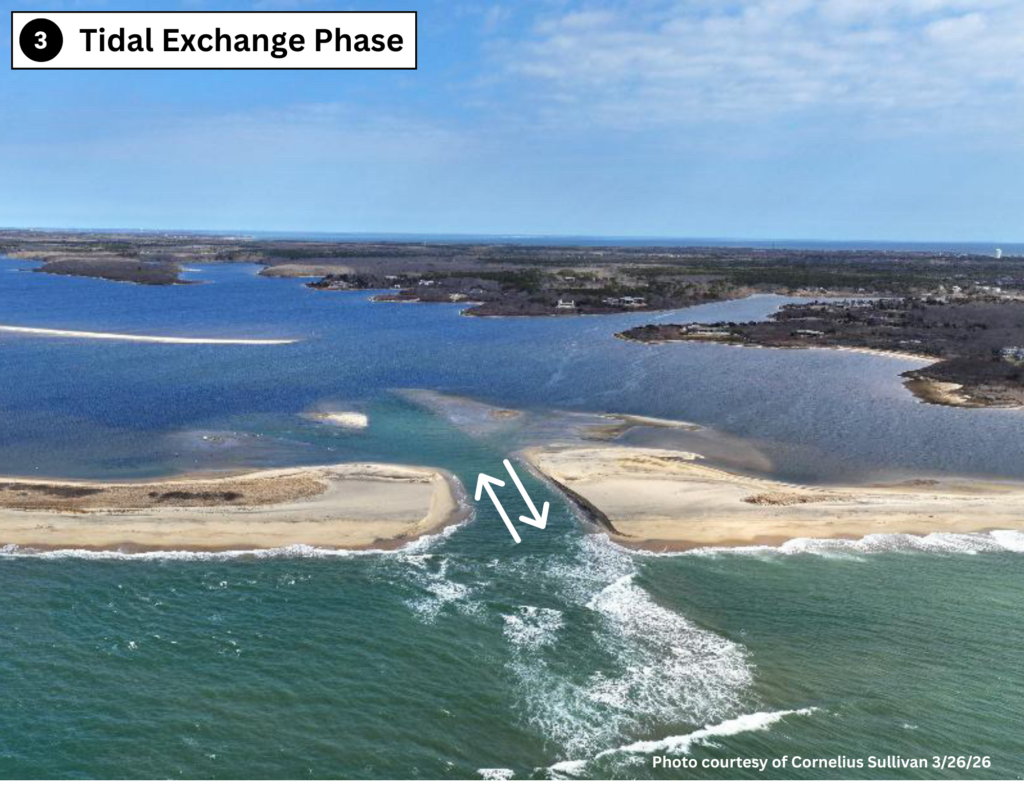
Water Levels Near Record Historic Highs
This cut was long anticipated by the community, as water levels in Edgartown Great Pond had risen to 4.84 feet above local mean sea level prior to the opening (Figure 2). As water levels climbed, areas that do not typically flood became submerged (Photo 5), increasing the risk of impacts to homes and infrastructure, accelerating shoreline erosion, and carrying nutrients from the surrounding land into the Pond. These inputs can further degrade water quality, which was seen after the EGP flooding event in March of 2018.
The Pond was just six inches below levels reached during the extreme flooding event of March 2018 (highest flooding event in recent memory). During this event, the Pond came into contact with lawns, leach fields, and structures causing both damage to property and the pond ecosystem. After an emergency cut was made, the elevation of EGP dropped an inch a minute as the immense volumes of water surged out of the Pond into the ocean. Ecosystem Scientists at the Marine Biological Laboratory in Woods Hole, MA indicated that the excess nutrients introduced from this flooding would impact the water quality and ecosystem health for 5 years. In the summer of 2019, EGP had its first filamentous macroalgal bloom in a decade.
Cut Phases
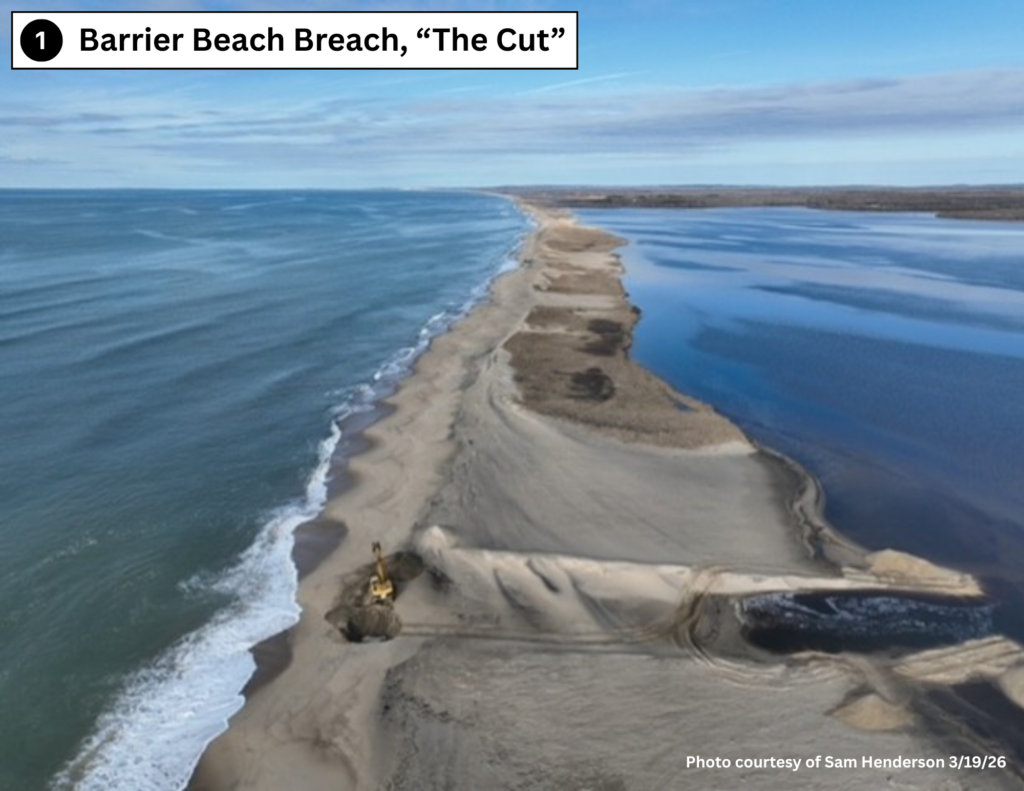
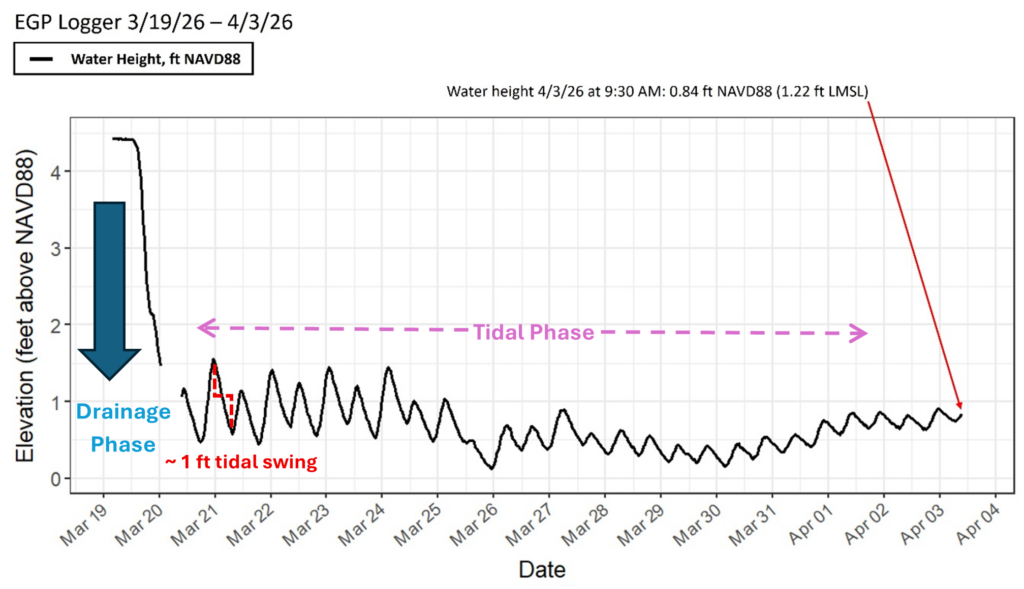
There are two phases to an opening or “cut”: 1) Drainage and 2) Tidal Exchange. The drainage phase happens in the beginning when the pond elevation drops, and water flows out of the pond in the ocean. The tidal exchange phase then follows after the 24-hour drainage period. This is when the pond and the ocean exchange water and organisms.
Following the cut on March 19th and the initial drainage phase, the Pond exhibited a strong and well‑defined tidal signal (Figure 3). The difference between high and low tide approached nearly one foot, signaling effective tidal exchange with the ocean. The last time a cut produced a tidal exchange of this magnitude was during the 11‑day opening in July 2024. This strong tidal phase is an encouraging indicator for the longevity of this cut. As of Friday, April 3rd, the Pond remains open and tidal, marking 15 consecutive days of continued exchange with the Atlantic. This is EGP’s longest cut since the 20-day opening in April of 2023.
EGP Salinity
Conductivity loggers are deployed in Wintucket Cove and Lyles Bay in Edgartown Great Pond year-round (Photo 7). These loggers give us consistent salinity levels throughout the year to better understand the health of the pond ecosystem and the impacts of the cuts.
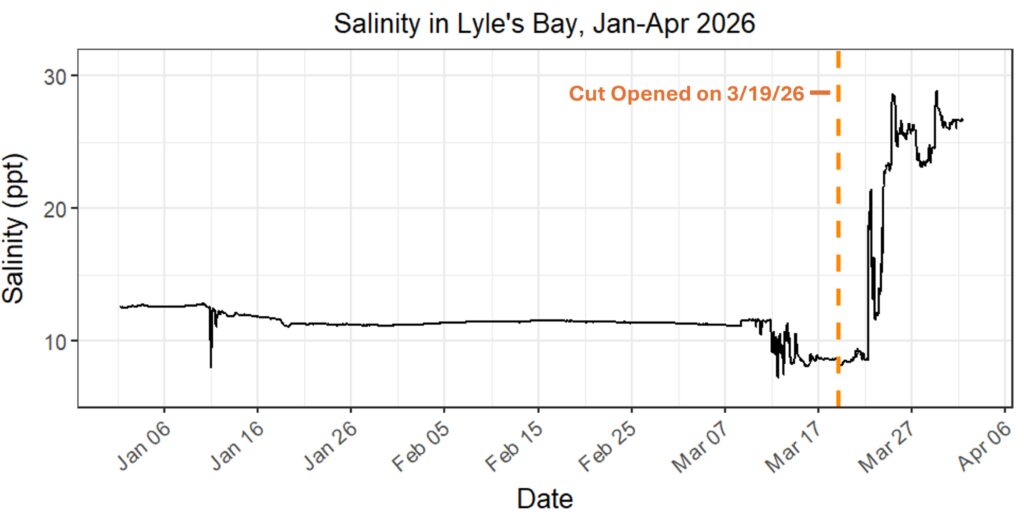
The flushing impact of the current cut is evident in our salinity data. For context, the salinity (a measure of salt content) of oceanwater is 32-36 parts per thousand (ppt), while freshwater is 0 ppt; anything in between is considered brackish. Prior to the cut, salinity in Lyle’s Bay had dropped below 10 ppt (Figure 4). This is worrisome given that eelgrass may become stressed when salinity levels fall below 15 ppt, and especially at levels below 10 ppt.
Fortunately, the current cut has raised salinity in Lyle’s Bay to more than 25 ppt (high brackish range), a much more optimal level for promoting eelgrass growth. This major salinity spike also indicates that the Pond has undergone a strong flush, helping to remove some amount of excess nitrogen prior to the summer.
Stay Updated With The Current & Future EGP Cuts!
Make sure to visit our EGP cut status page to explore the most recent EGP data and photos of the cut!
Work Cited
Lloret, J., Giblin, A., & McHorney, R. (2021). Determination of the relative contribution of various sources of nitrogen to primary production in Martha’s Vineyard ponds. The Ecosystems Center, Marine Biological Laboratory. https://greatpondfoundation.org/wp-content/uploads/MV-Ponds-N-source-contributions_2021.pdf
Scrollable
MV CYANO PUBLIC PRESENTATION

2026 GPF Events
EGP March 2026 Cut Story
Choose Both: Island Environment & Housing
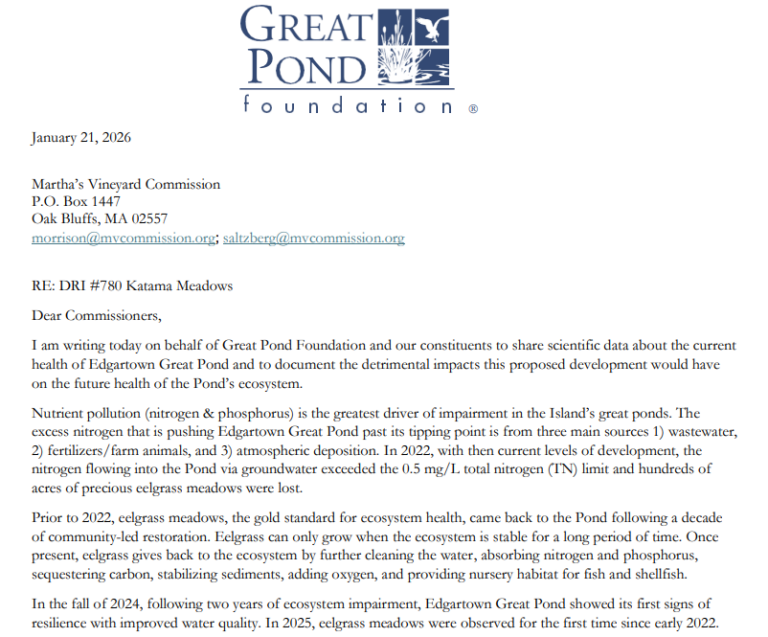
GPF Letter to MVC