
EGP Cut Status
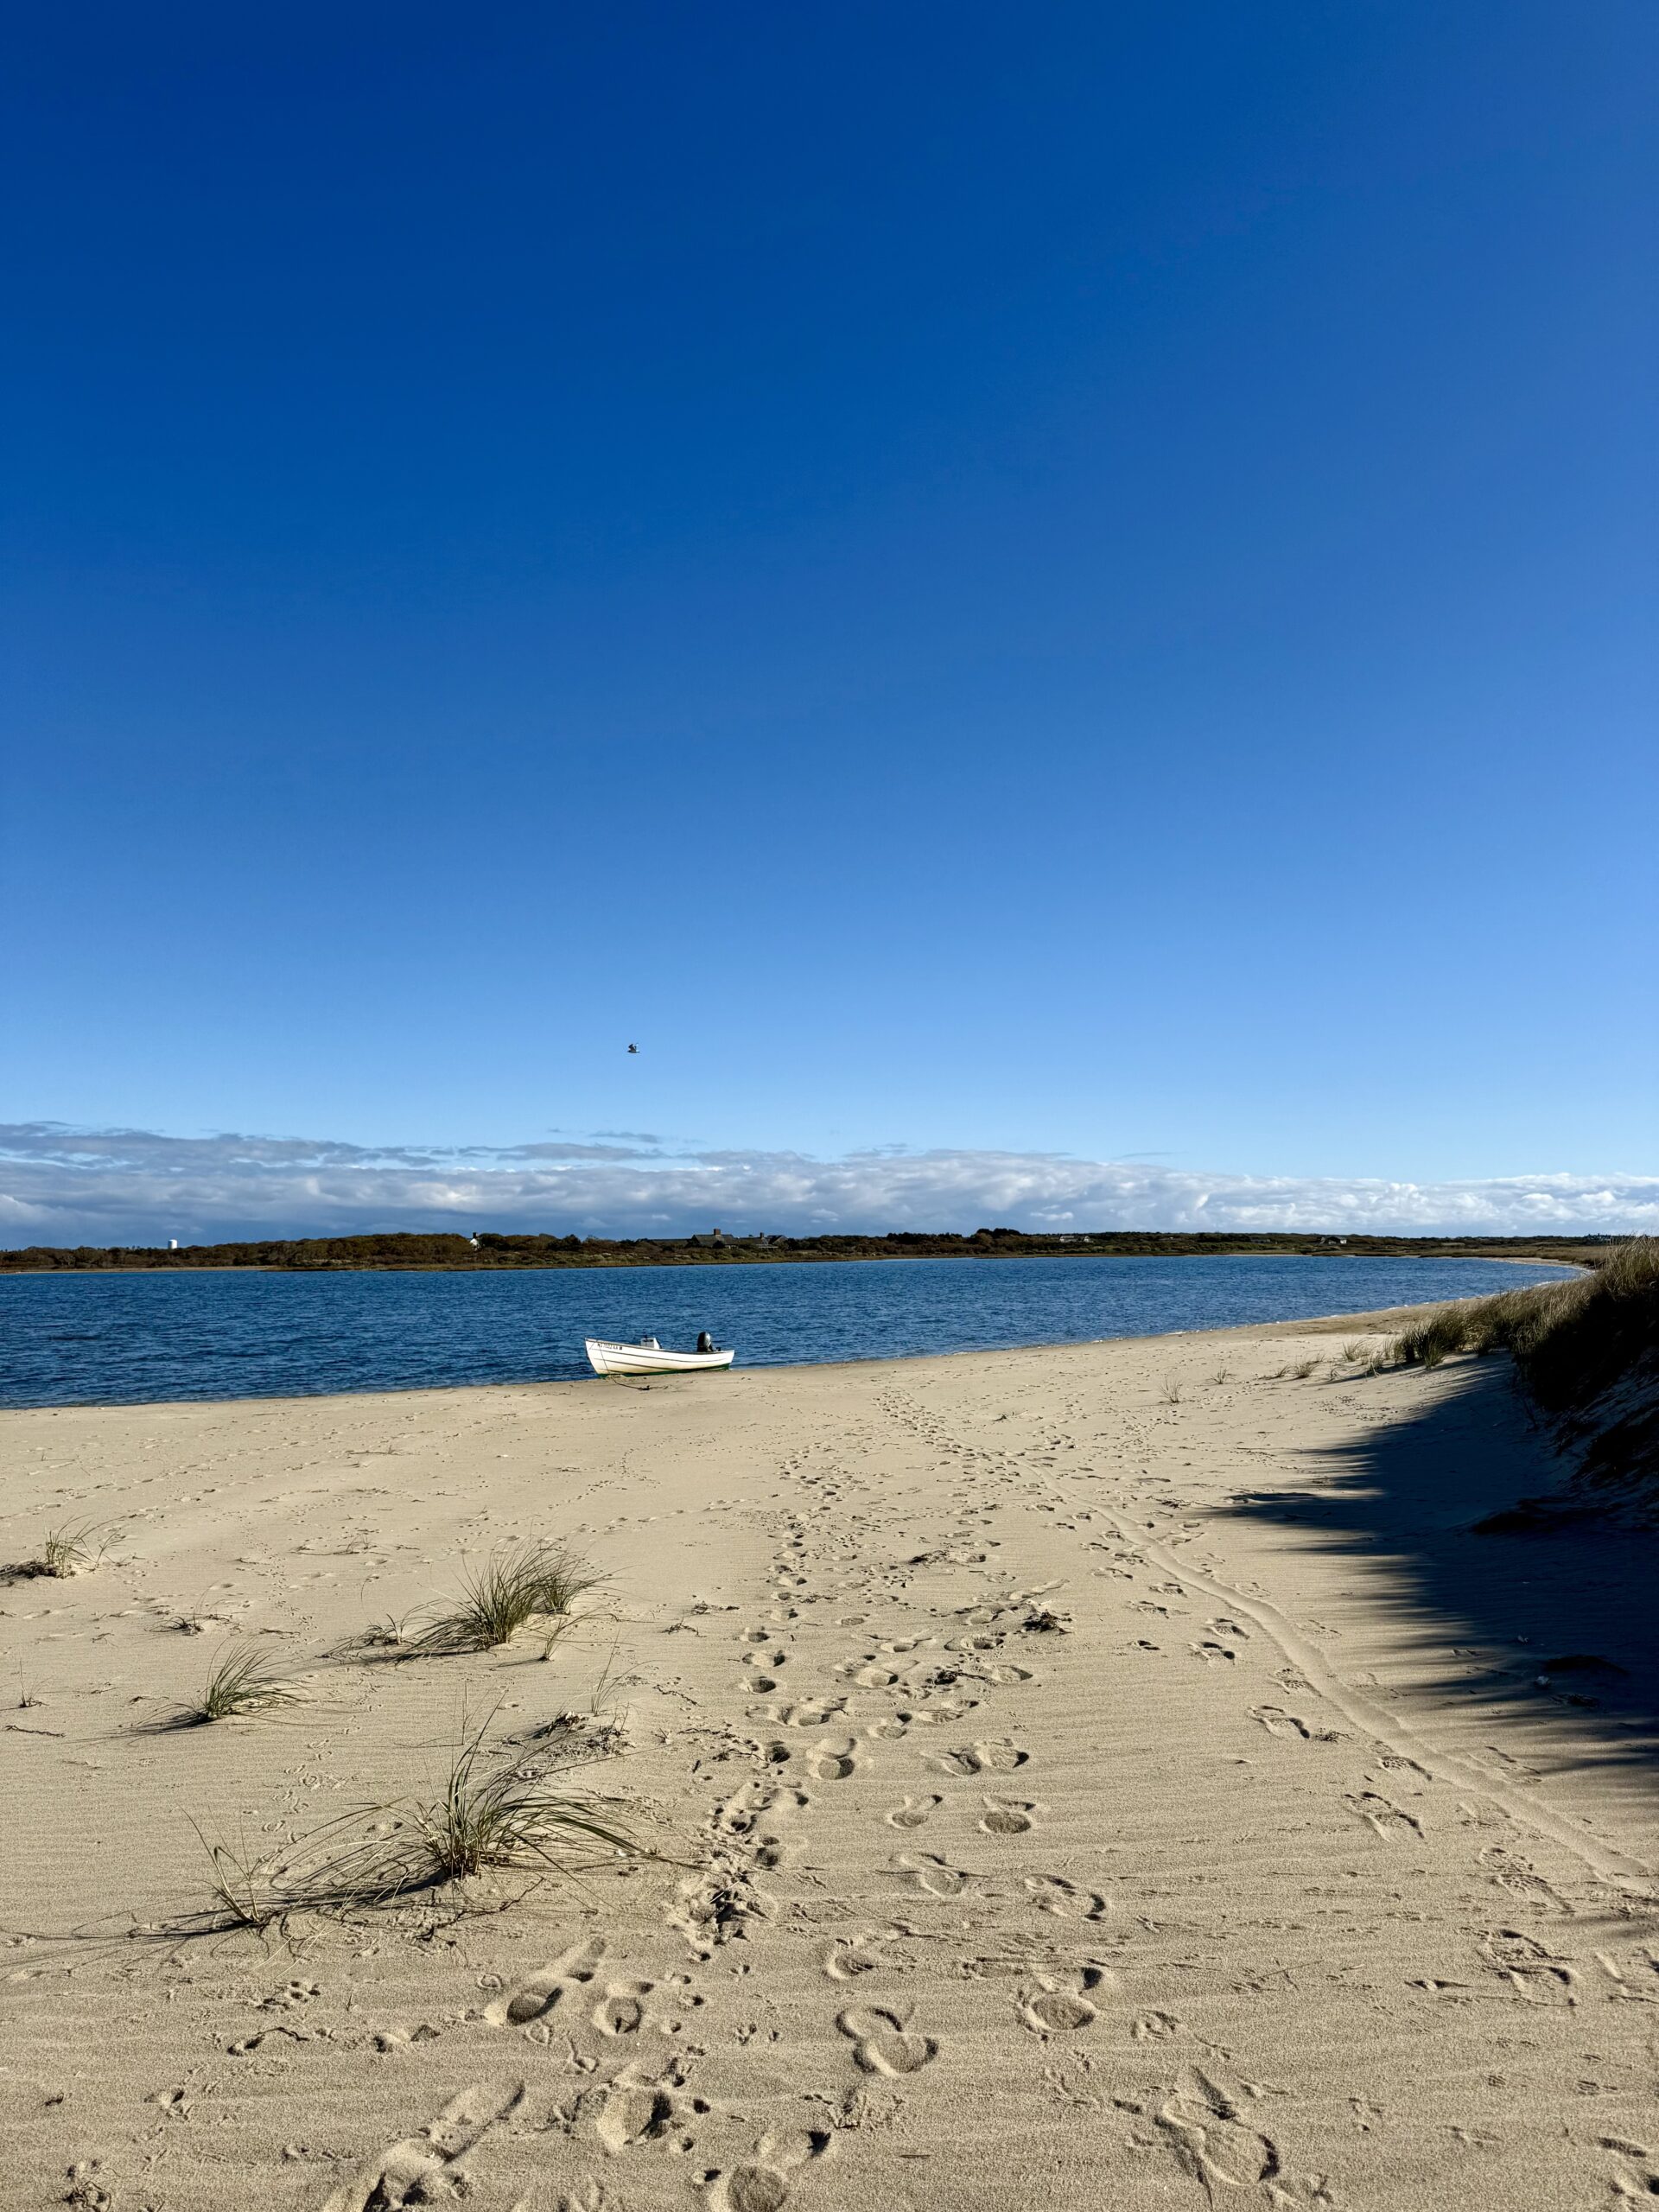
CURRENT EGP CUT STATUS: Closed as of April 7th, 2026
KEY DATES:
CUT OPENED: March 19th, 2026
CUT CLOSED: April 7th, 2026
TIDAL EXCHANGE: 18 days
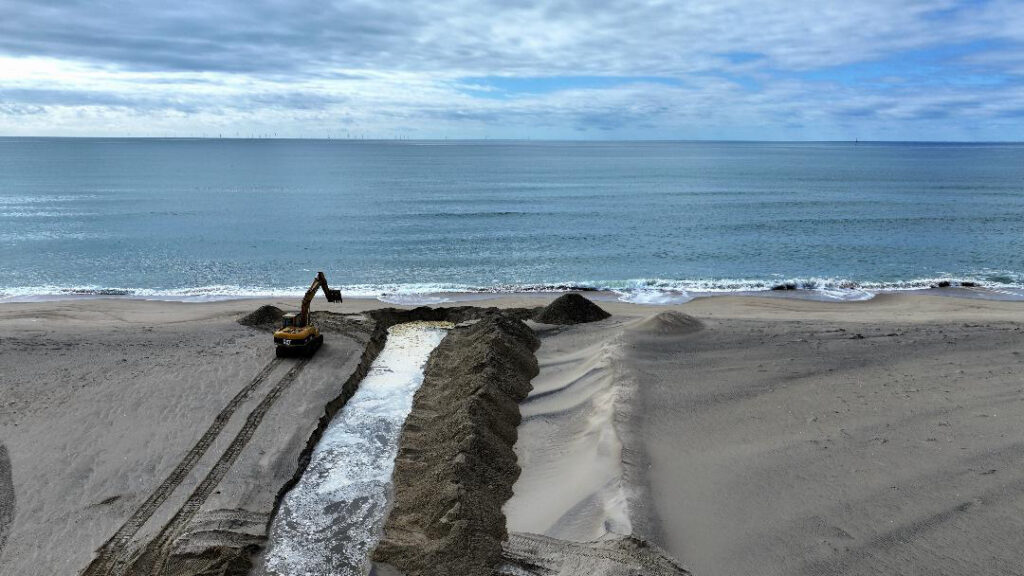
Photo courtesy of Cornelius Sullivan.
Elevation Data (click on arrow)
►Recent Elevation Data
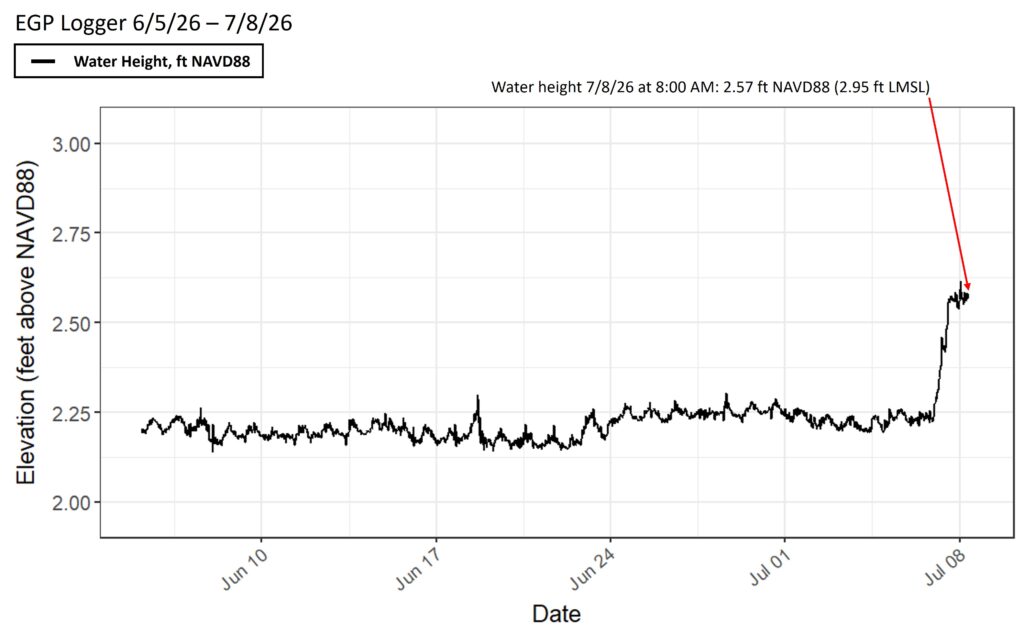
Readout Edgartown Great Pond elevation data as of 7/8/26. The elevation of the Pond was recorded at 2.57 ft above NAVD88 (2.95 ft LMSL).
Explore Past EGP Cut Data & More! (click on the arrow)
►March 2026 Cut
EGP Salinity Throughout Cut:
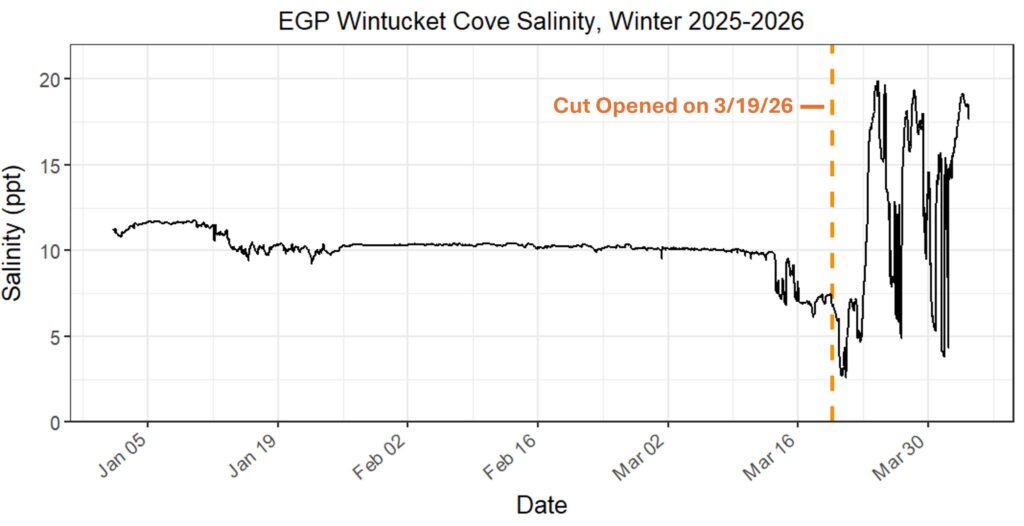
Figure 1: Readout of Wintucket Cove in Edgartown Great Pond salinity data in parts per thousand (ppt) from winter 2025 to April 2026 showing levels before and after the March 19th, 2026, cut. Salinity at the head of the cove was at about 17 ppt as of Friday, April 3rd.
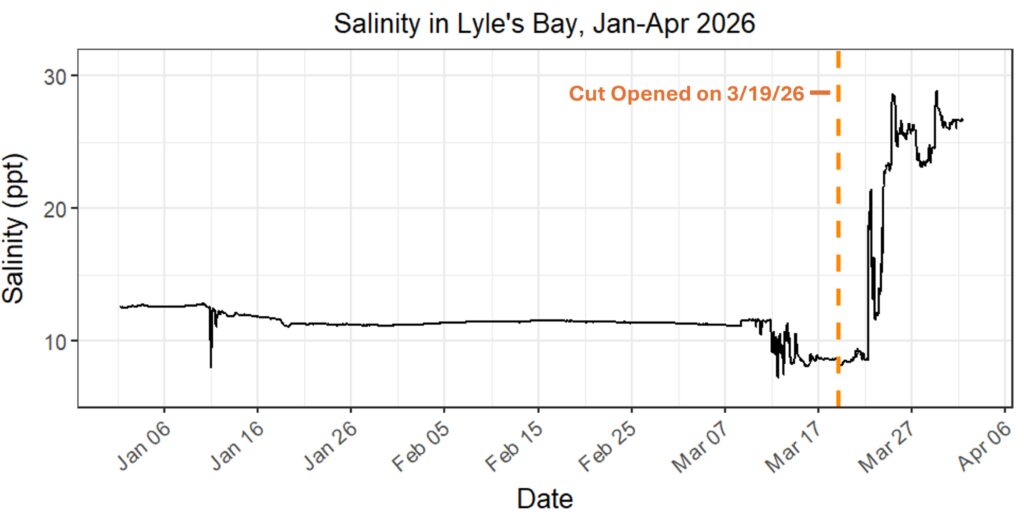
Figure 2: Readout of Lyles Bay in Edgartown Great Pond salinity data in parts per thousand (ppt) from January 2026 to April 2026 showing levels before and after the March 19th, 2026, cut. Salinity levels in Lyles Bay rose from 10 ppt to 27 ppt after the cut!
EGP Elevation Throughout Cut:
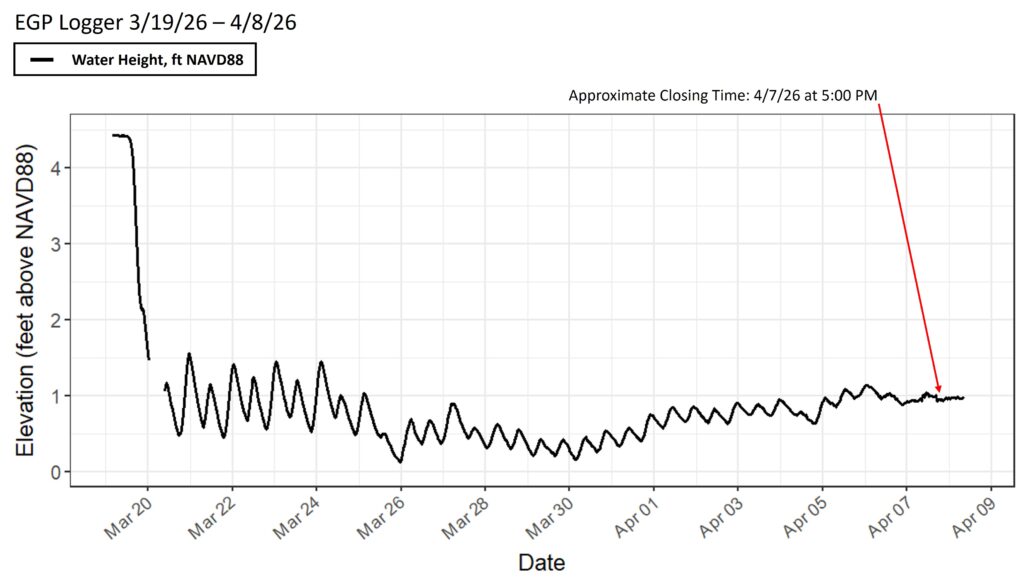
Figure 3: Readout of Edgartown Great Pond elevation data relative to NAVD88 from March 19th 2026 to April 8th 2026. The cut closed on April 7th around 5 pm with the logger data showing a fizzling out tidal signal yesterday evening. This would entail a 19-day opening, the best EGP cut since the 20-day opening in April of 2023!
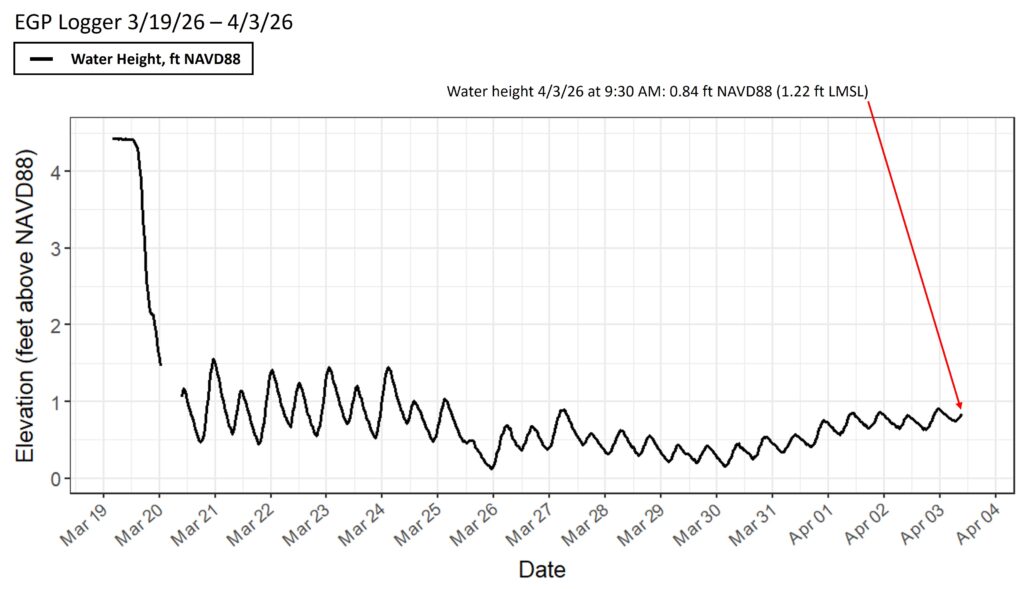
Figure 4: Readout of Edgartown Great Pond elevation data relative to NAVD88 from March 19th 2026 to April 3rd 2026. The Pond’s latest elevation (on 4/3/26) was recorded at 1.22 feet above local mean sea level. The cut remains open (15 days and counting).
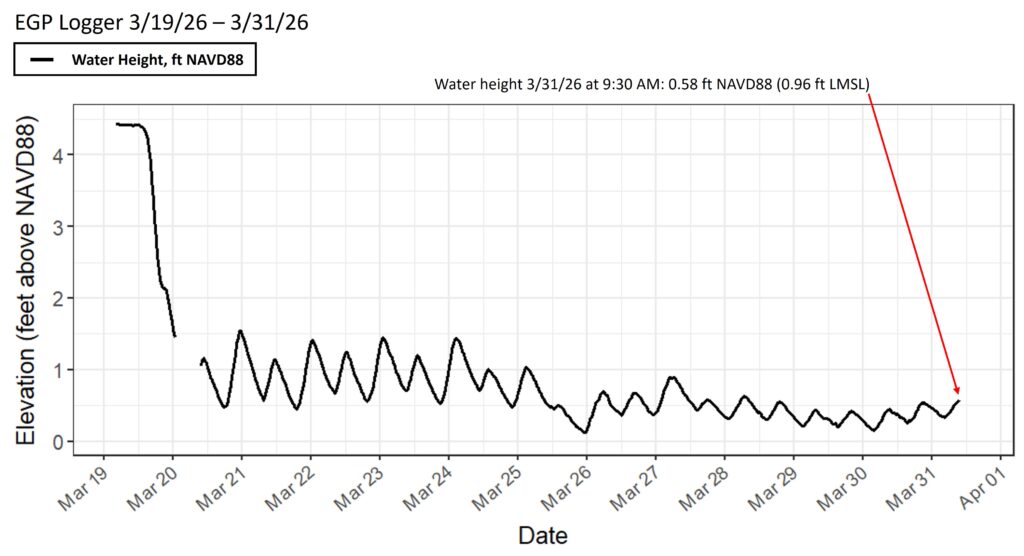
Figure 5: Readout of Edgartown Great Pond elevation data relative to NAVD88 from March 19th 2026 to March 31st 2026. The Pond’s latest elevation (on 3/31/26) was recorded at 0.96 feet above local mean sea level. The cut remains open (12 days and counting), although the tidal signal is gradually weakening.
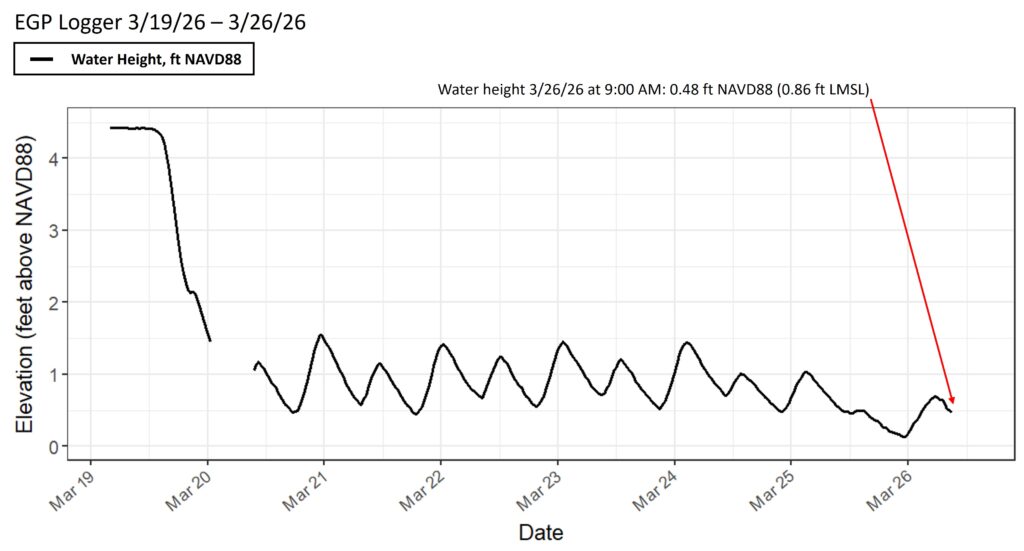
Figure 6: Readout of Edgartown Great Pond elevation data relative to NAVD88 from March 19th 2026 to March 26th 2026. The Pond’s latest elevation (on 3/26/26) was recorded at 0.86 feet above local mean sea level. The Pond continues to exhibit a strong tidal signal indicating the cut remains open (7 days and counting)
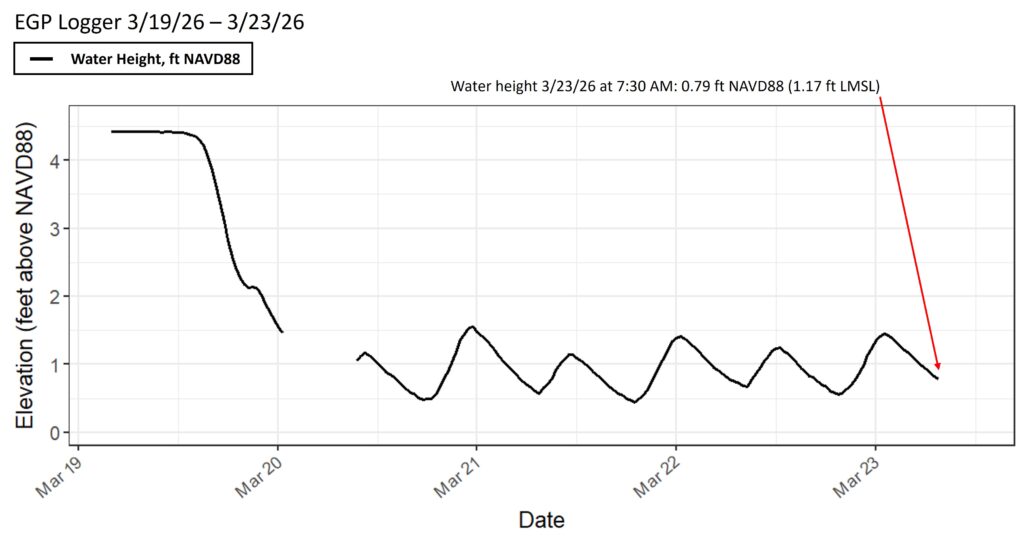
Figure 7: Readout of Edgartown Great Pond elevation data relative to NAVD88 from March 19th 2026 to March 23rd 2026. The Pond’s elevation (on 3/23/26) was recorded at 1.17 feet above local mean sea level. The Pond continues to exhibit a strong tidal signal with the tidal swing between high and low tide currently close to 1 foot.
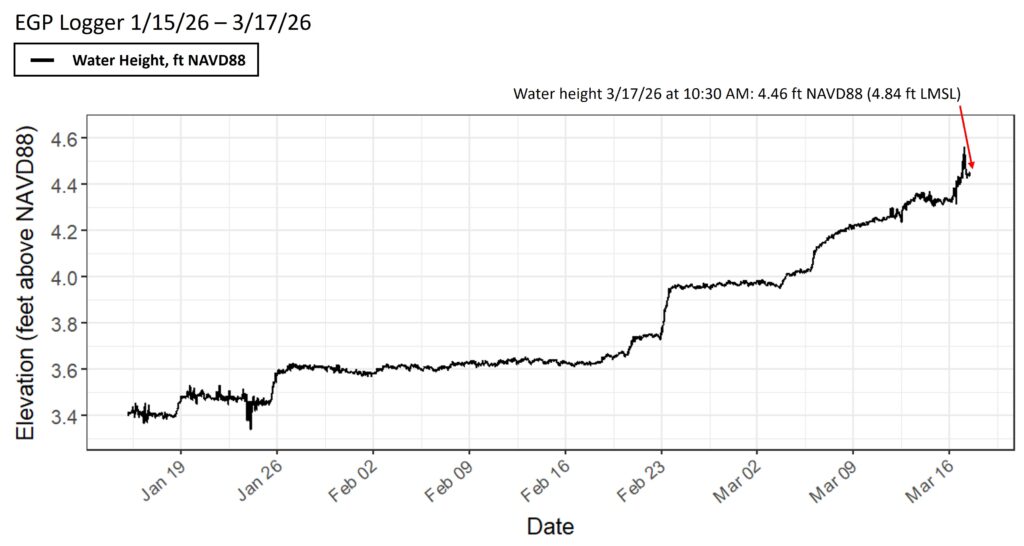
Figure 8: Readout of Edgartown Great Pond elevation data relative to NAVD88 from January 15th 2026 to March 17th 2026. The pond’s latest elevation (on 3/17/26) was recorded at 4.84 feet above local mean sea level.
EGP Cut Photos:
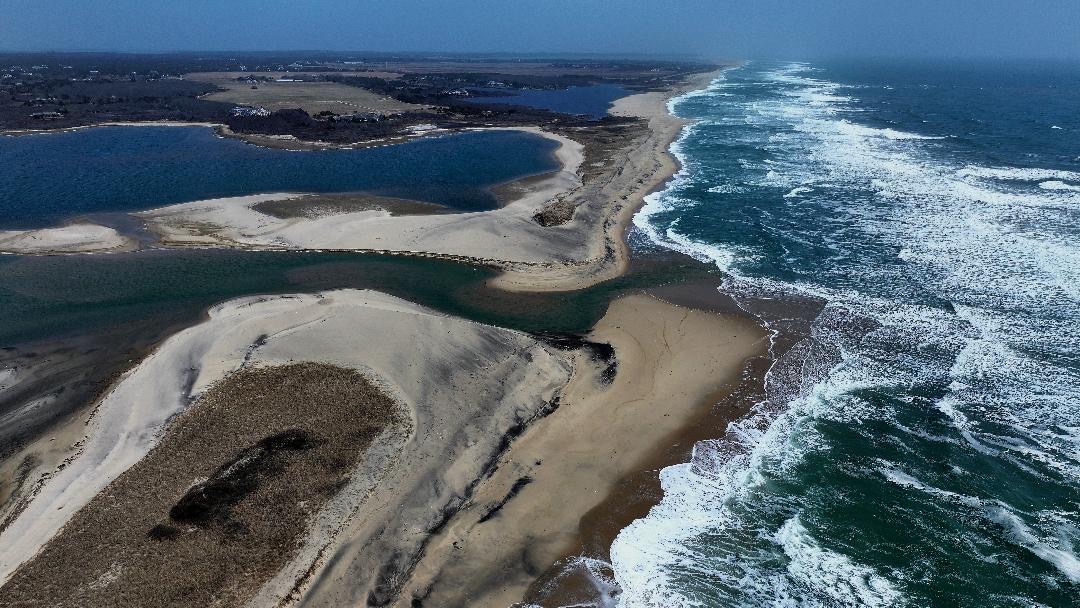
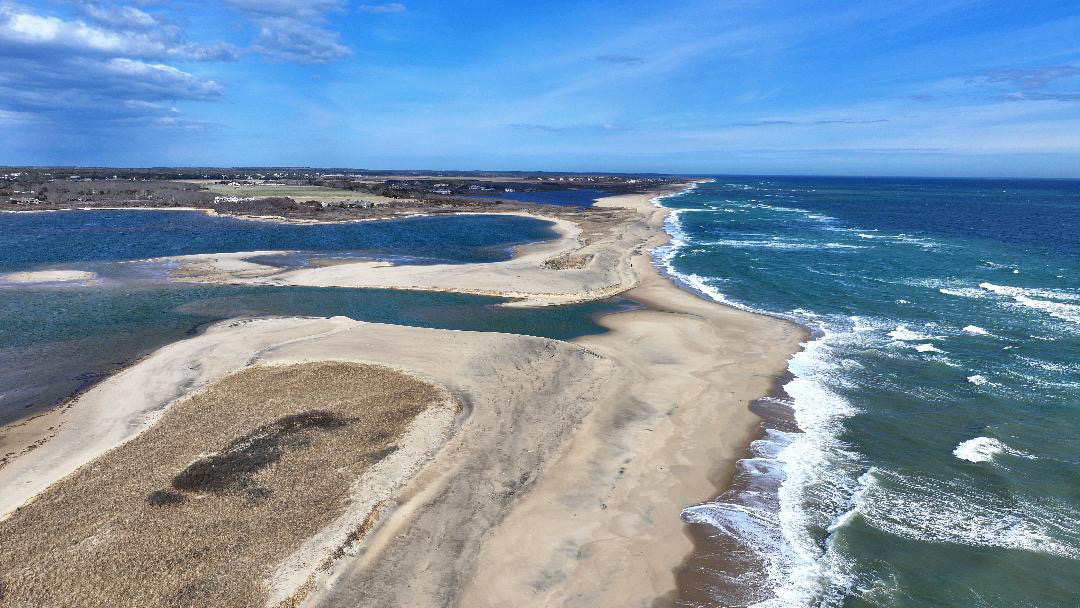
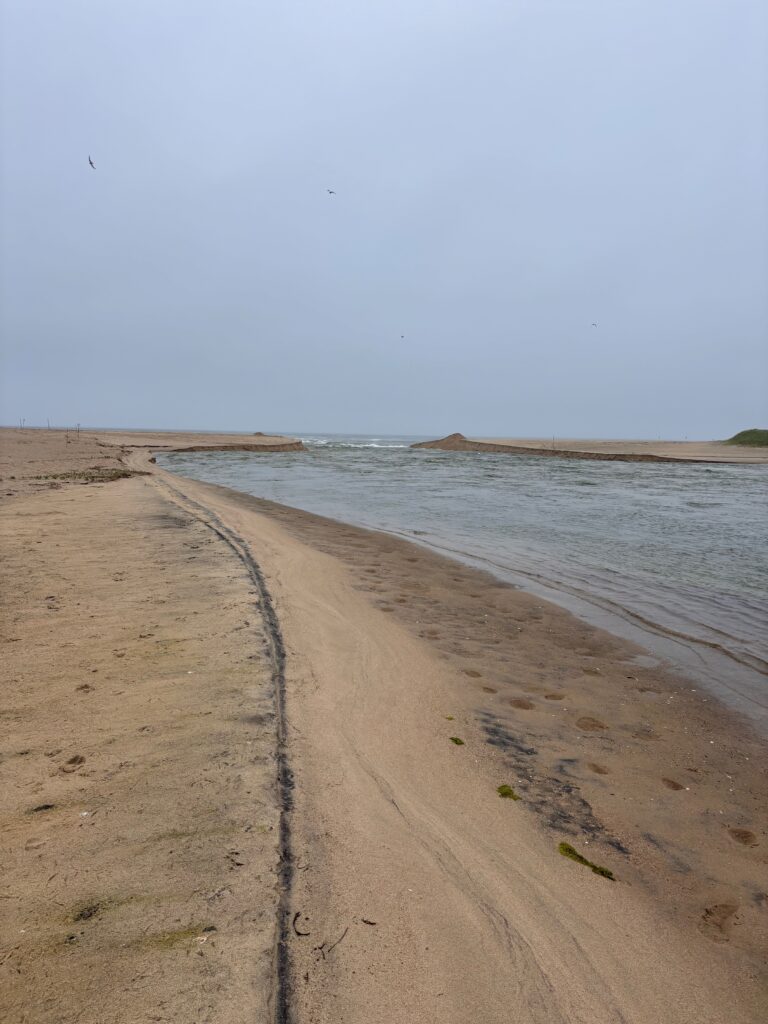
Photo of EGP cut taken on 3/31/26. The pond remained open to the ocean, although the tidal signal and opening was gradually weakening. Photo courtesy of Cornelius Sullivan.
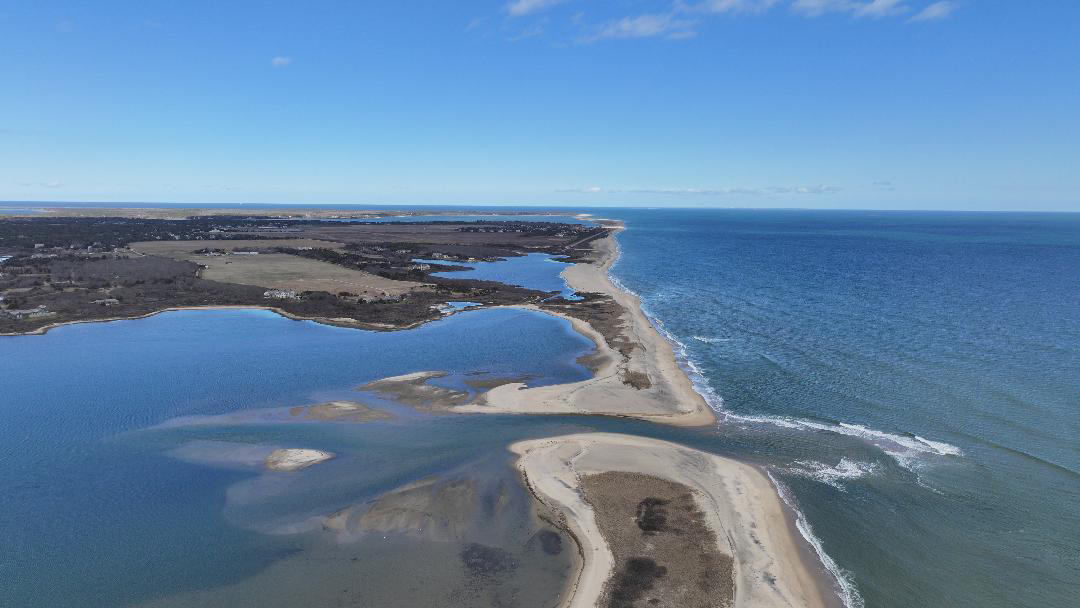
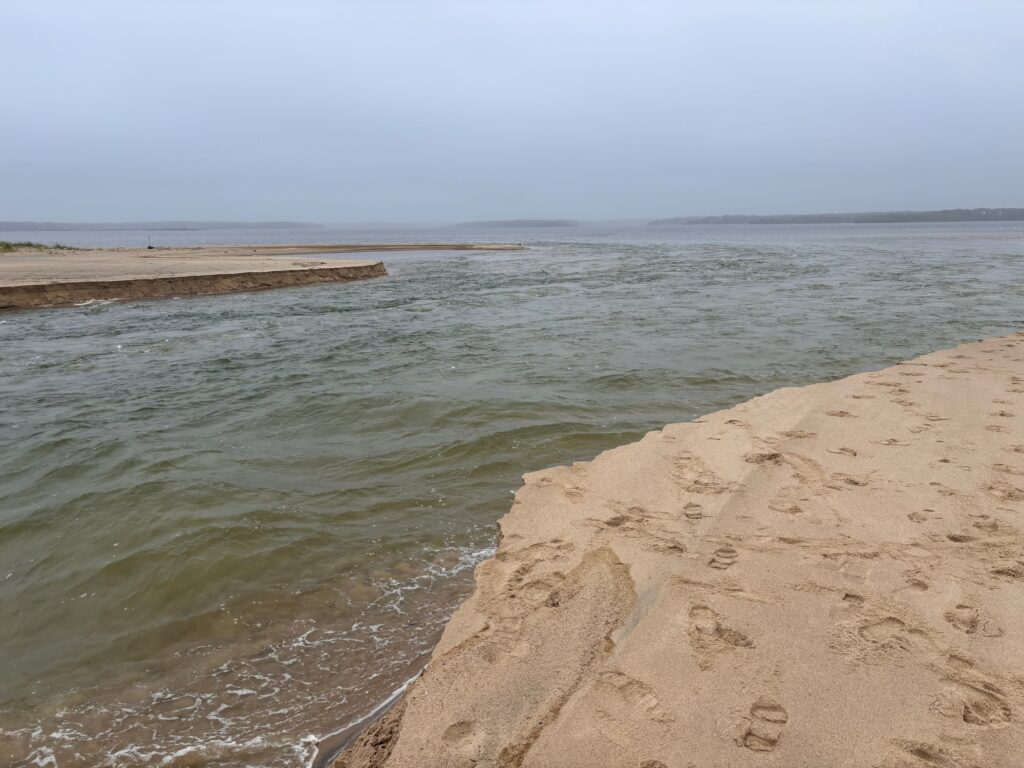
Photo of EGP cut taken on 3/24/26. Photo courtesy of Cornelius Sullivan.
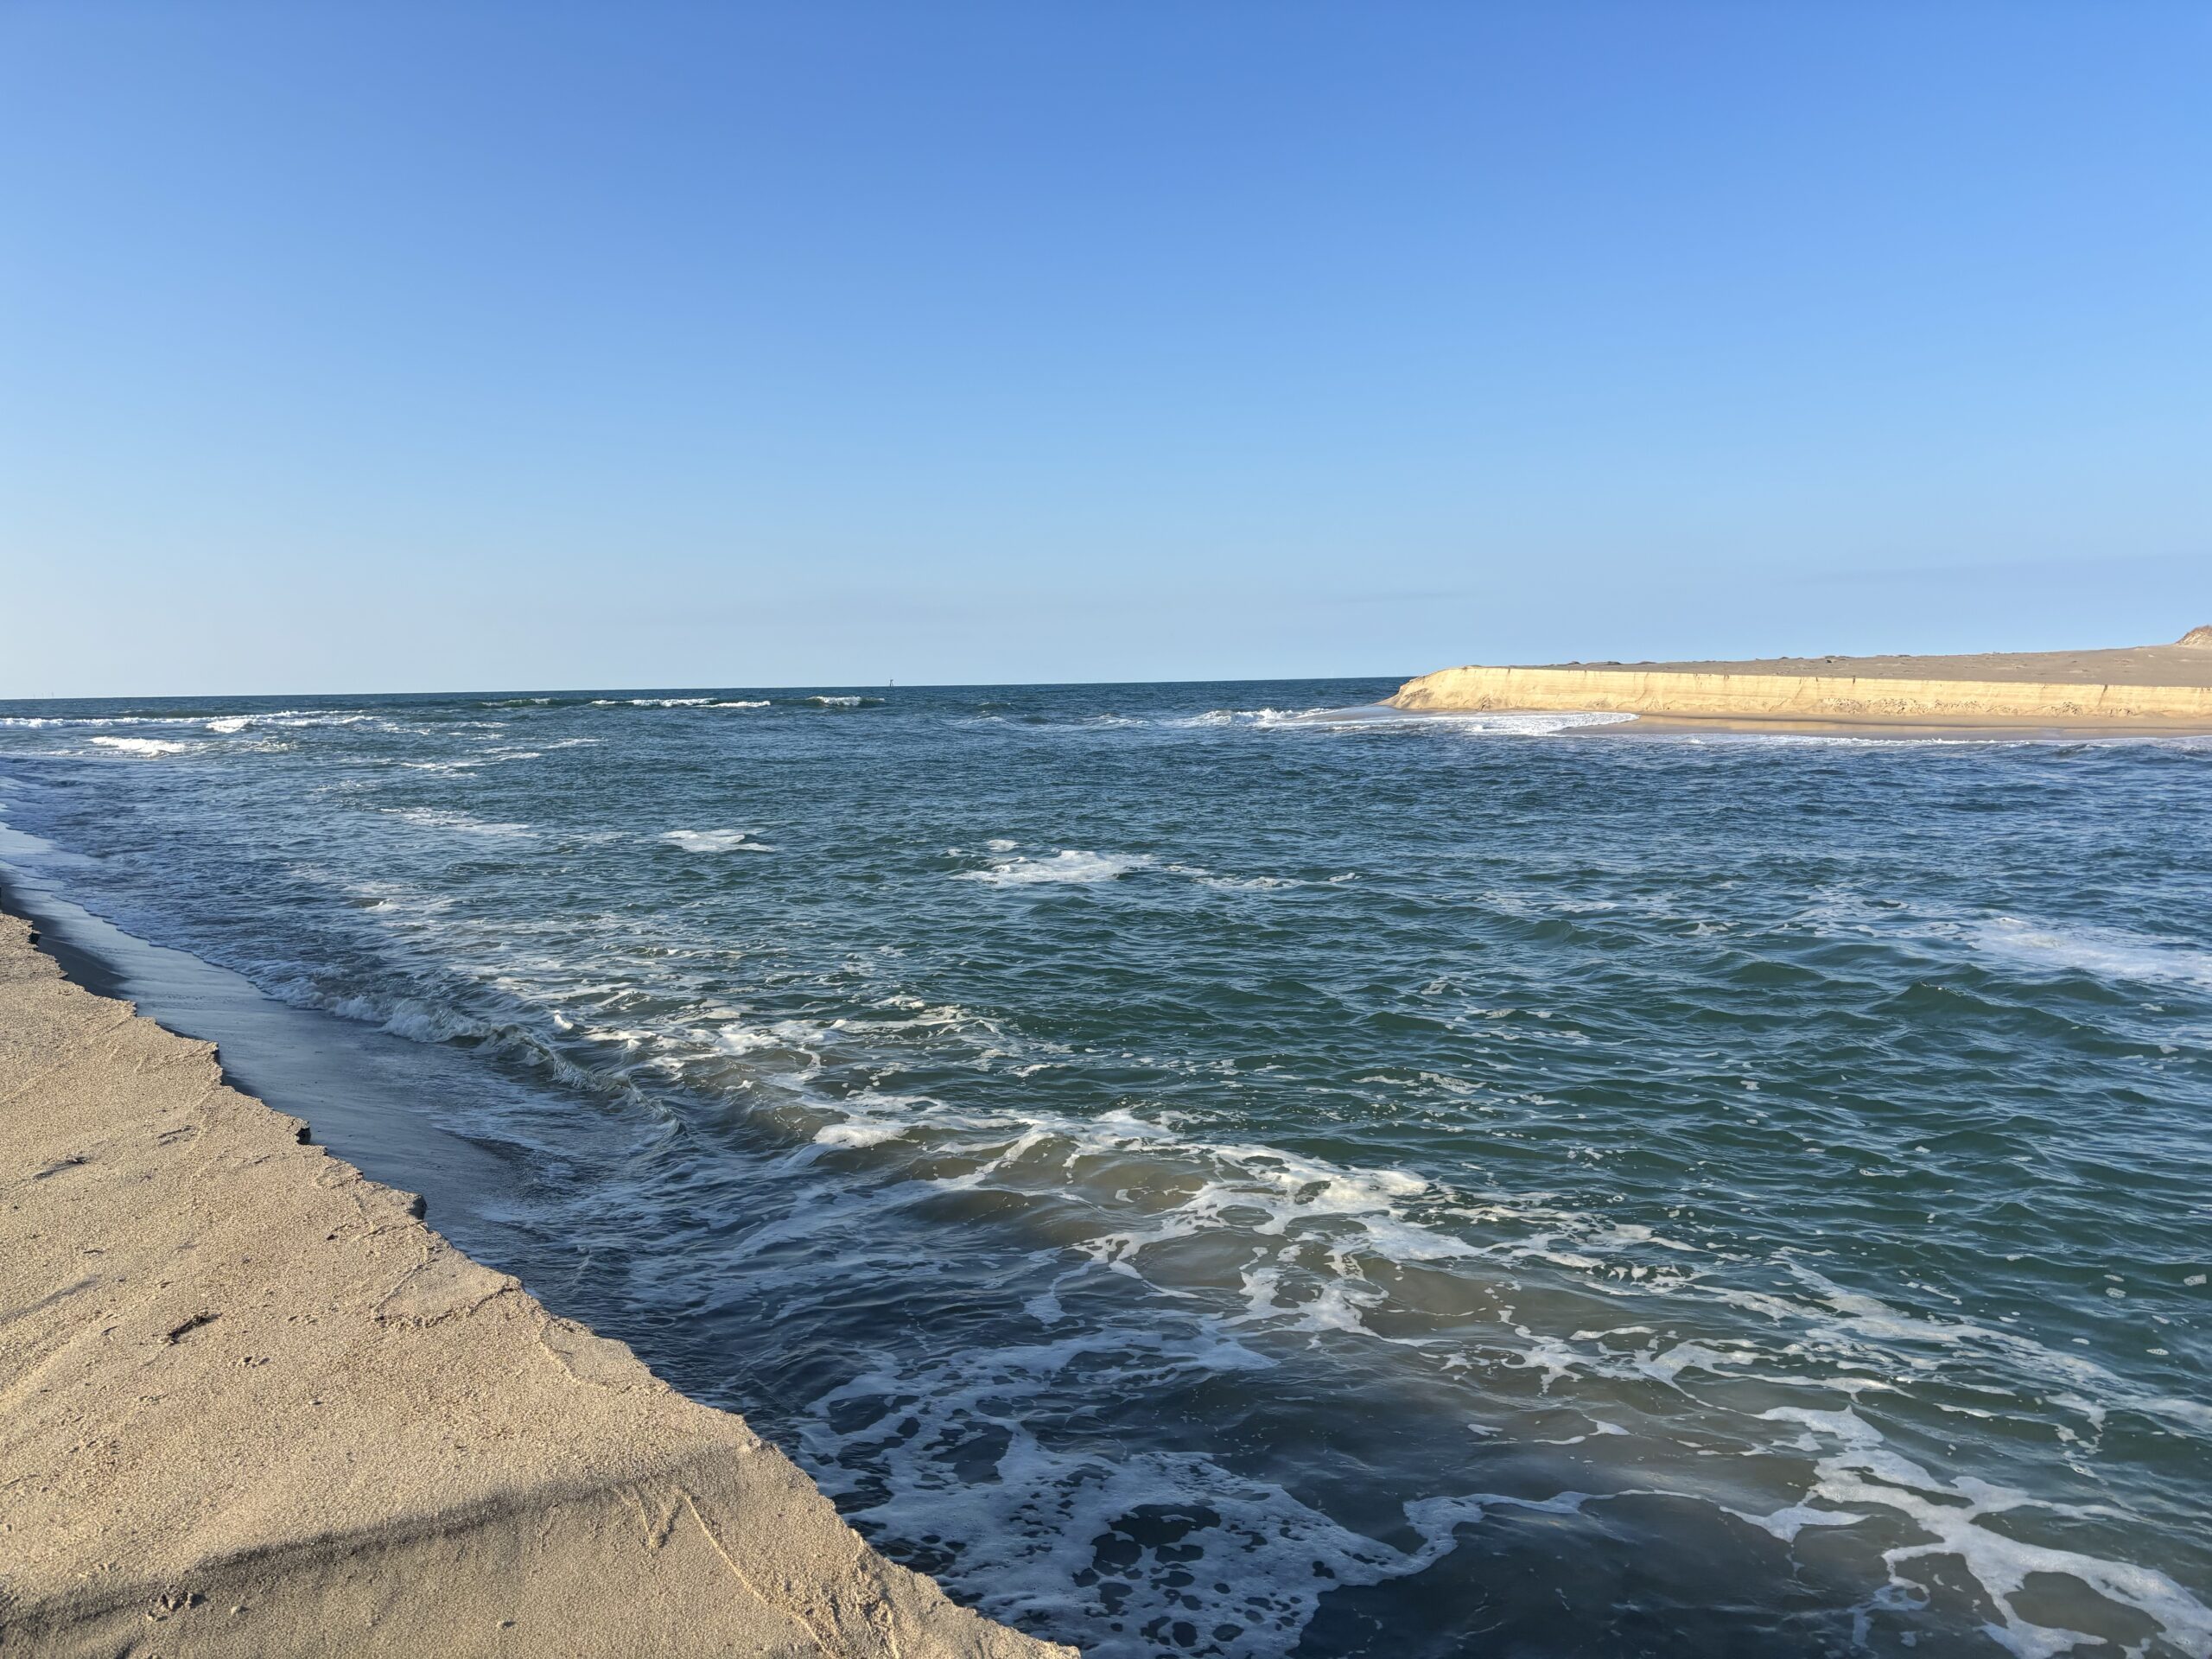
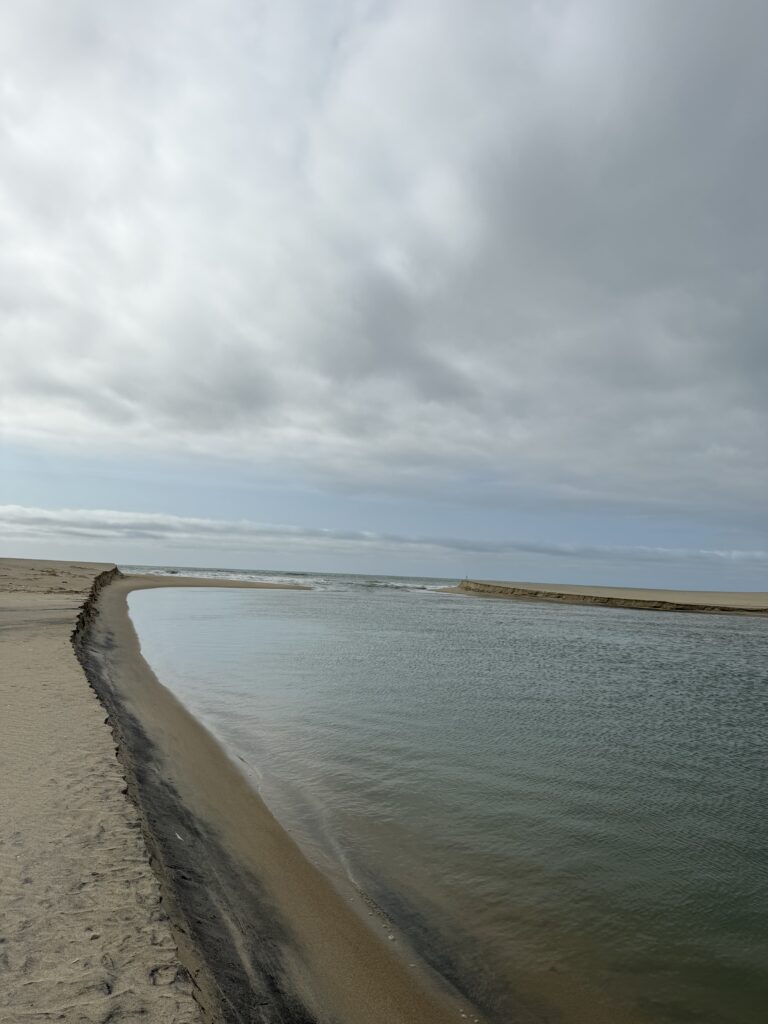
Photo of EGP cut taken on 3/20/26. Photo courtesy of Kendall Rudolph.
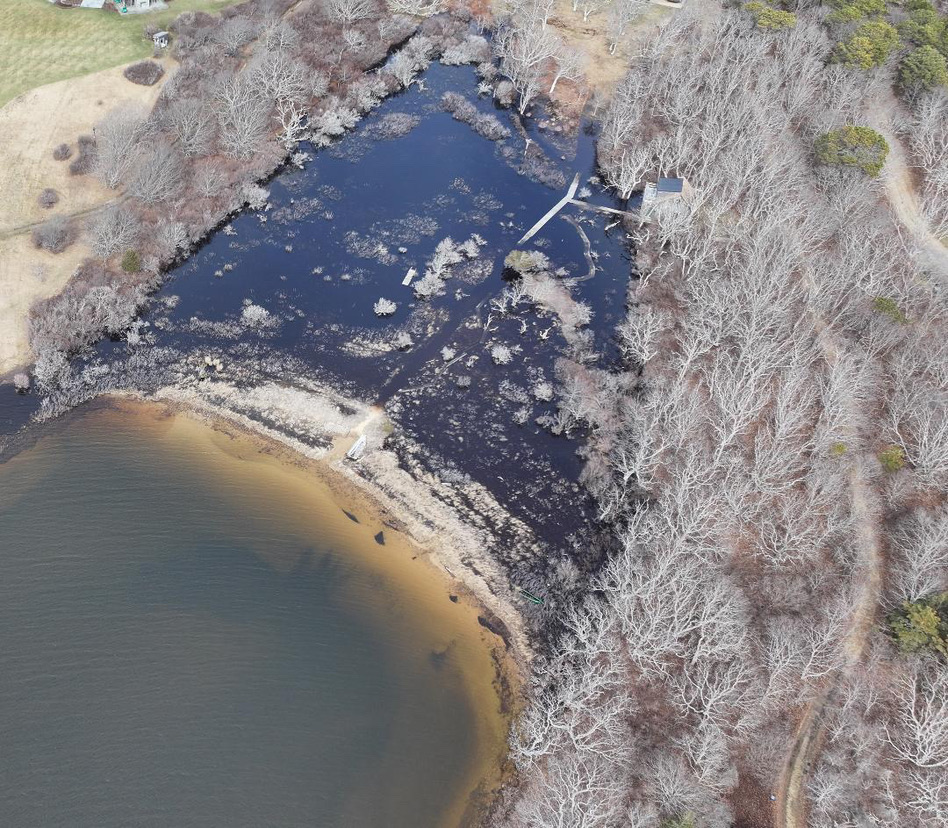
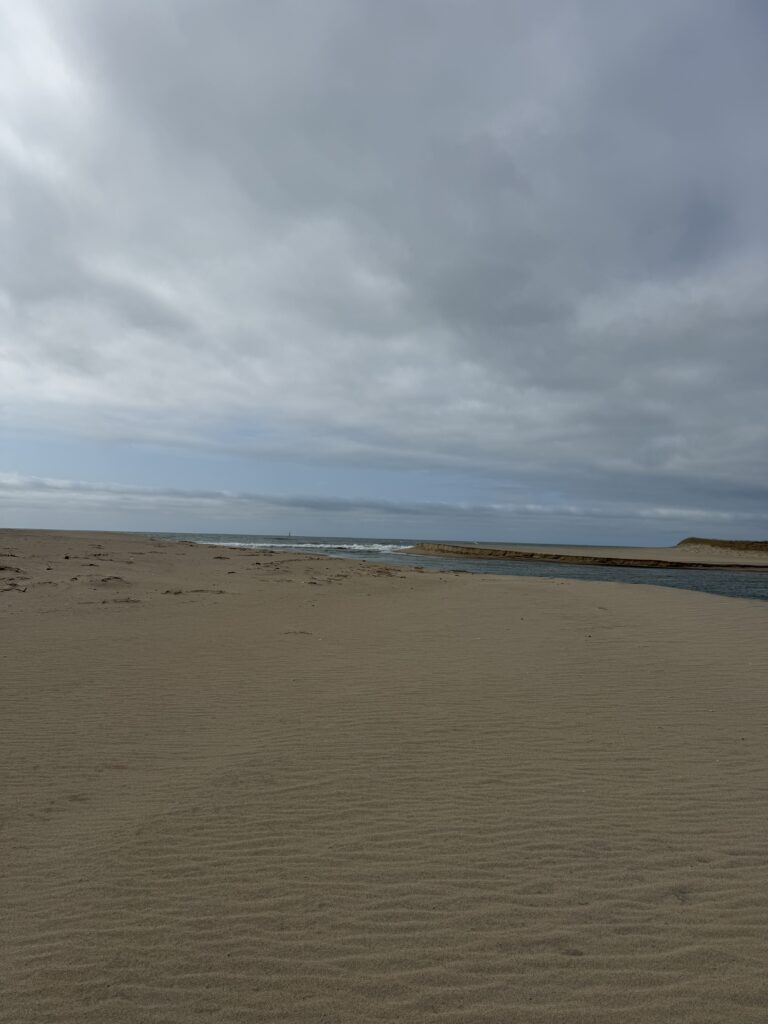
Precut photo of flooded area in Turkeyland Cove taken on 3/18/26. Pond elevation was at about 4.84 ft LMSL. Photo courtesy of Cornelius Sullivan
►June 2025 Cut
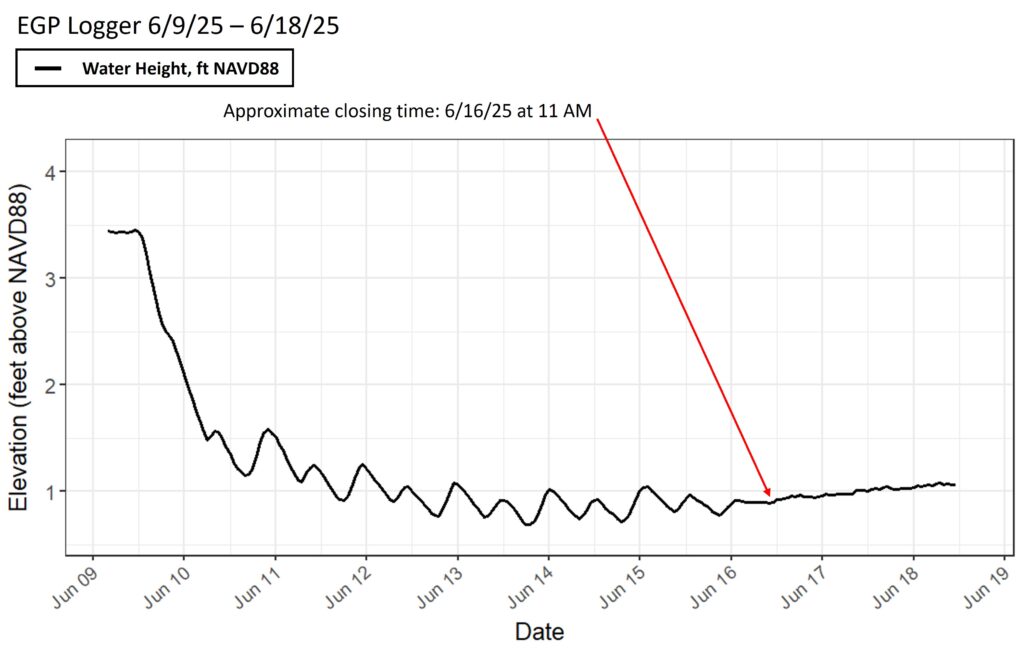
Figure 1: This graph illustrates the elevation relative to NAVD88 of Edgartown Great Pond from 6/9/25 (day the pond was cut) to 6/18/25 (two days after the cut closed). It appears the cut closed sometime on Monday 6/16 around 11 AM; this would entail a 7- day opening.
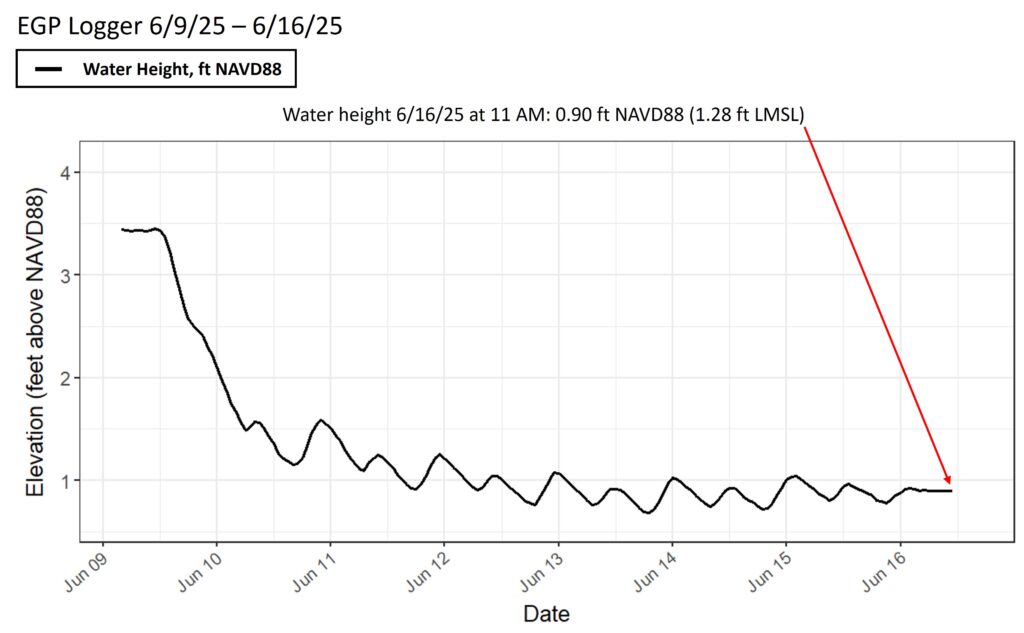
Figure 2: This graph illustrates the elevation relative to NAVD88 of Edgartown Great Pond from 6/9/25 (day the pond was cut) to 6/16/25 (day the cut closed). As of 11 AM on June 16th, the Pond was tidal, although the signal appeared to be weakening. Elevation was measured at 0.90 feet above NAVD88 (1.28 ft LMSL)
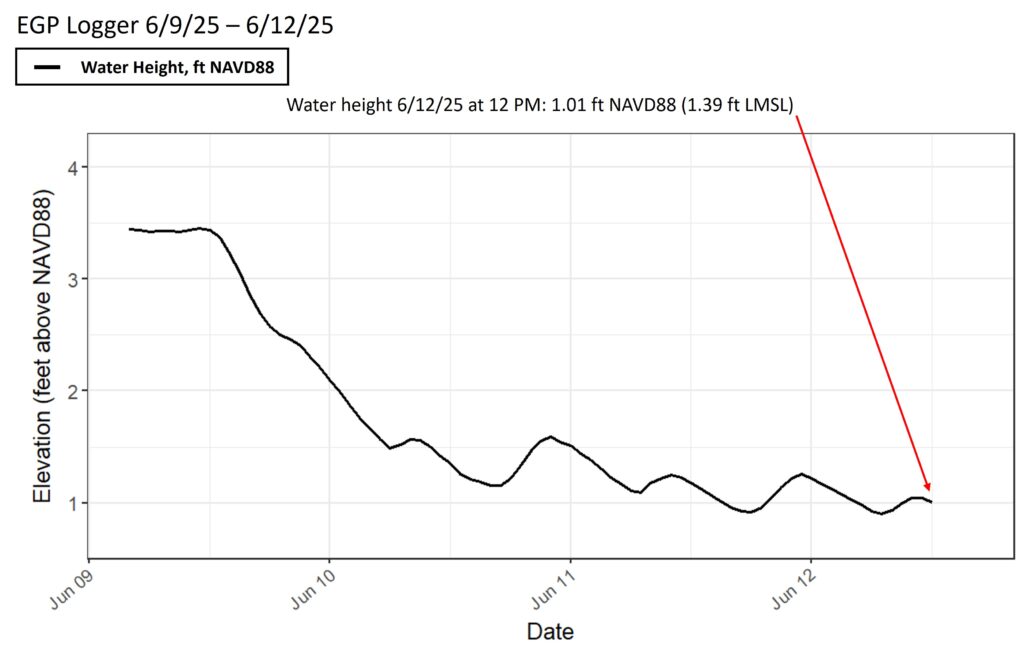
Figure 3: This graph illustrates the elevation relative to NAVD88 of Edgartown Great Pond from 6/9/25 (day the pond was cut) to 6/12/25 (cut was still open). As of 6/12 at noon, the pond was still exhibiting a tidal signal. Elevation was measured at 1.01 ft above NAVD88 (1.39 ft LMSL).
Video Courtesy of Dana Gaines; June 12th, 2025
Video Courtesy of Dana Gaines; June 12th, 2025
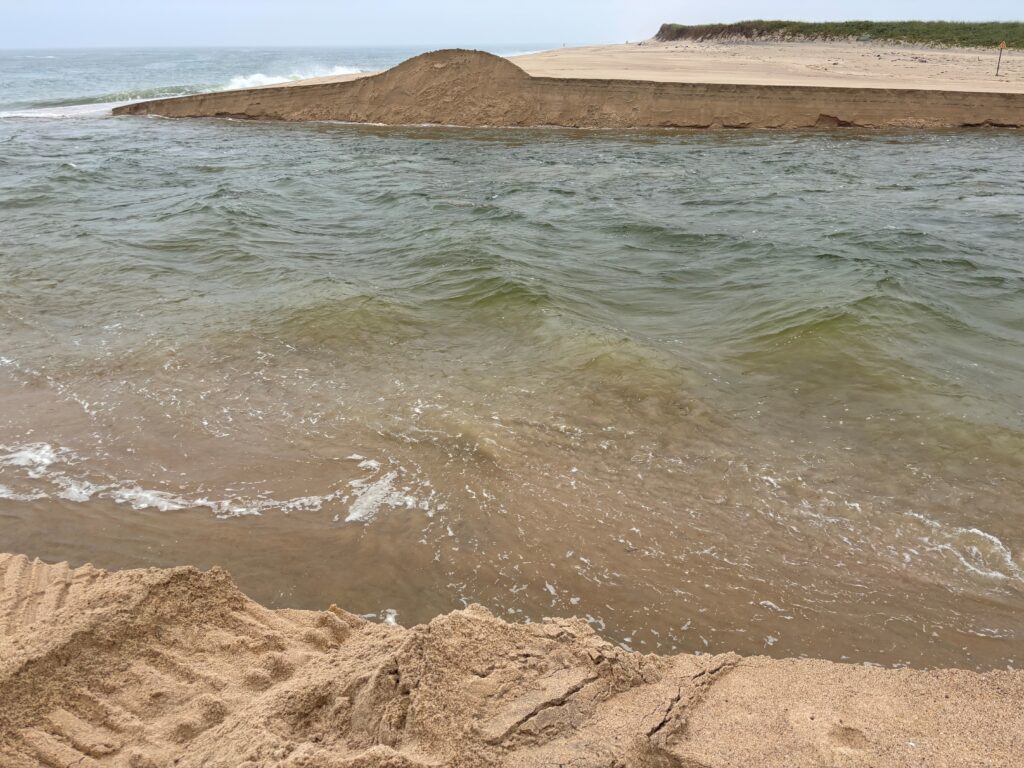
Photos taken on June 9th, 2025
Video taken on June 9th, 2025
►March 2025 Cut
The pond was open to the ocean for 8 days, almost reaching the ideal 9-11 day cut opening target. The EGP cut, although not as long as we had hoped, had a positive and measurable impact on the Pond. Ideal cuts increase overall salinity 8-12 ppt pond wide. Data collected following the cut from loggers at Lyle’s Bay and Wintucket Cove indicates salinity increased ~10 ppt.
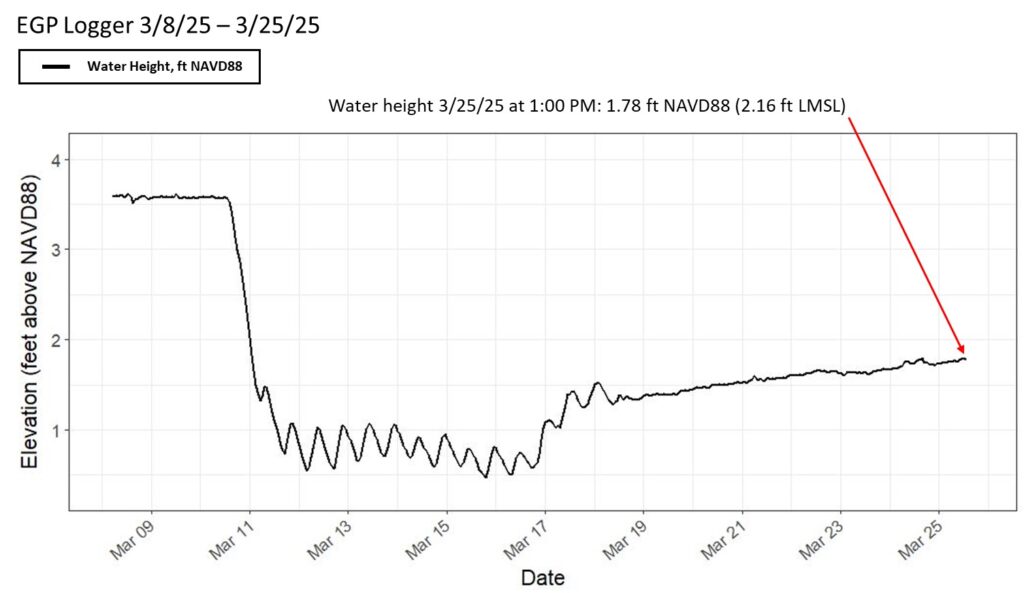
Figure 1: This graph illustrates the elevation relative to NAVD88 of Edgartown Great Pond from 3/8/25 to 3/25/25. The elevation on March 10, 2025 was ~3.64 ft NAVD88 (4.02 ft LMSL). On March 20th, following the 8 day cut the elevation dropped to 1.50 ft NAVD88 (1.88 ft LMSL). Since then, as shown in the graph above, the elevation has slowly increased. As of March 25th, the elevation is 1.78 ft NAVD88 (2.16 ft LMSL).
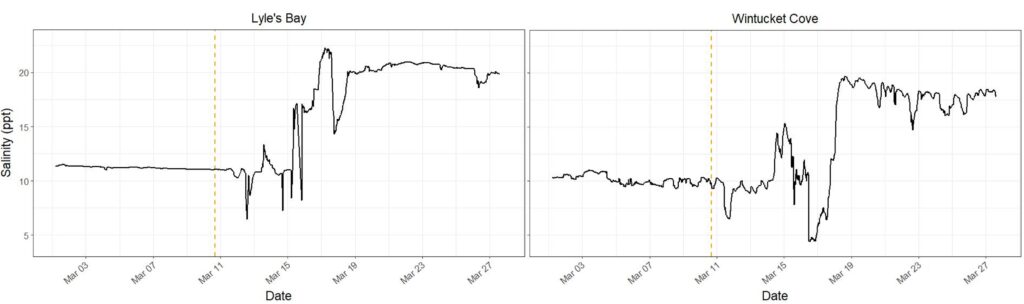
Figure 2: These graphs illustrate the salinity (ppt) of Edgartown Great Pond before and after the 8-day cut in both Lyle’s Bay and Wintucket Cove. The yellow line represents the cut timing, while the black represents salinity (ppt). EGP’s ideal salinity is 20 ppt. Pond cuts allow tidal exchanges which increase pond salinity and water clarity. As shown above data collected from loggers at Lyle’s Bay and Wintucket Cove indicates salinity increased ~10 ppt after the March 10th cut.
 From June through October stay up to date with cyanobacteria advisories on our MVCYANO page.