Pond Elevation: Logger Offloads & Recent Elevation Data
Edgartown Great Pond, Chilmark Pond, & Tisbury Great Pond Elevation Data
Offseason Elevation Data Collection
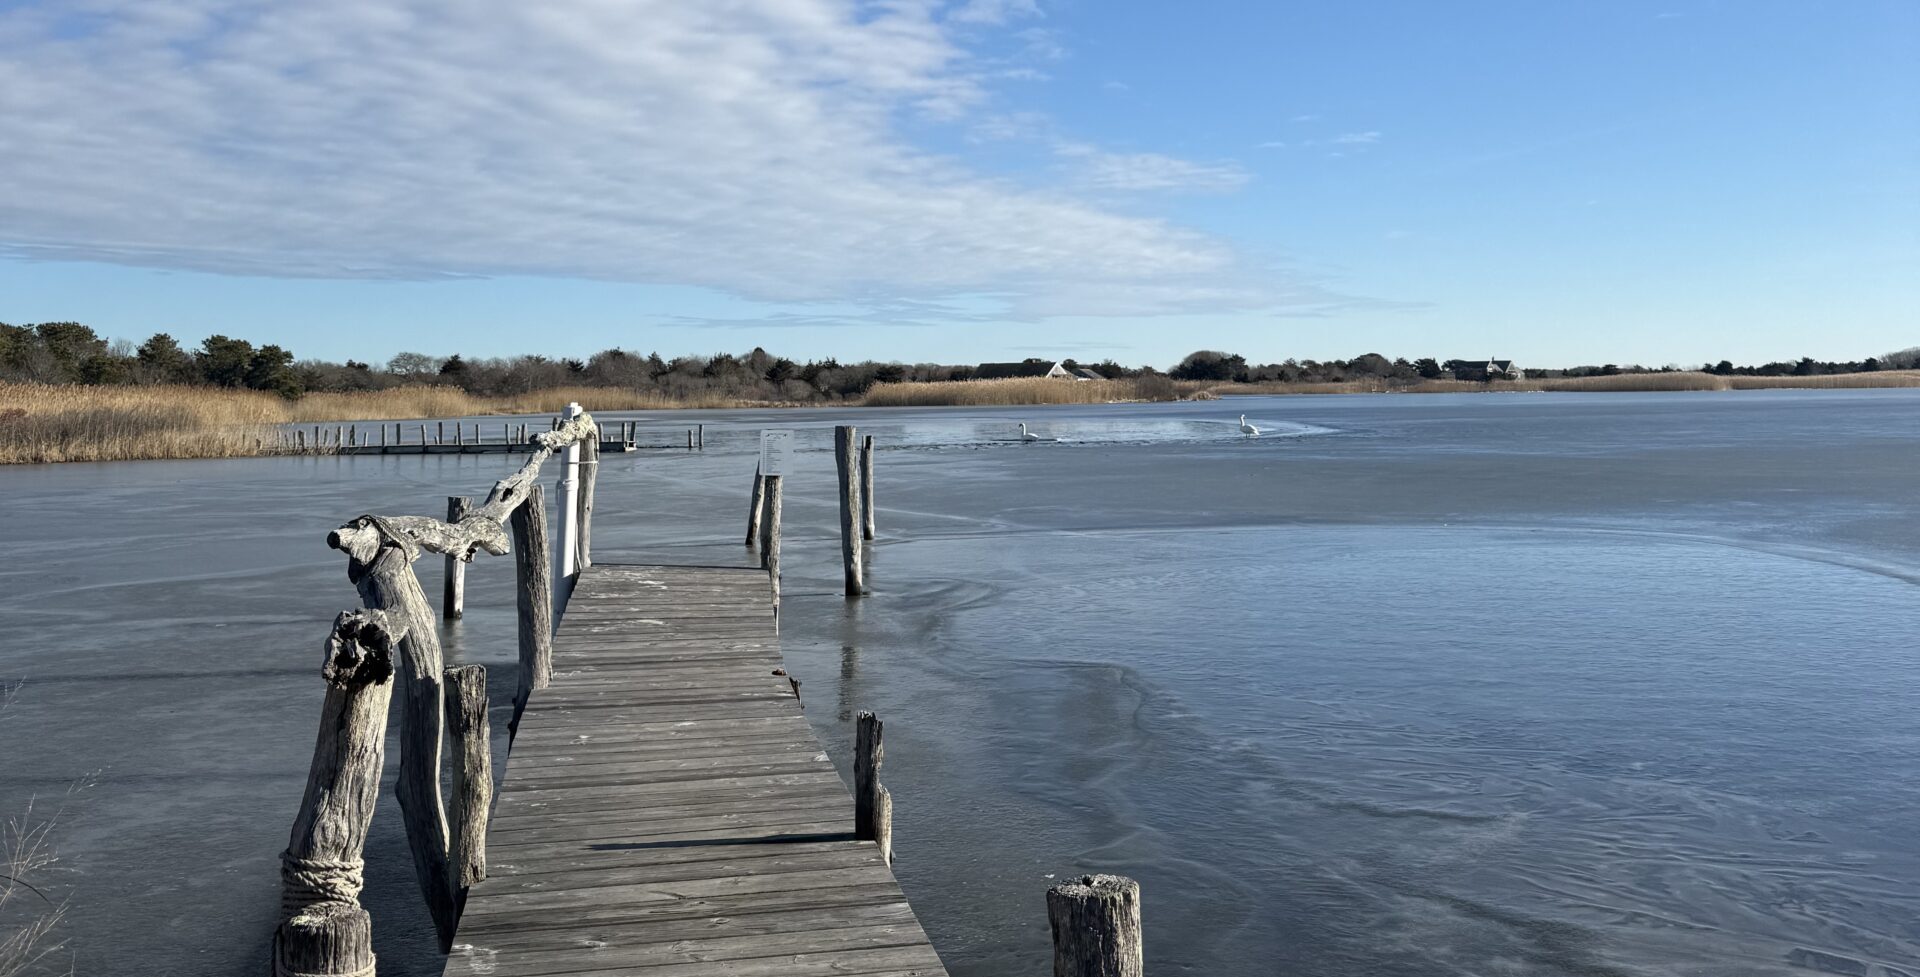
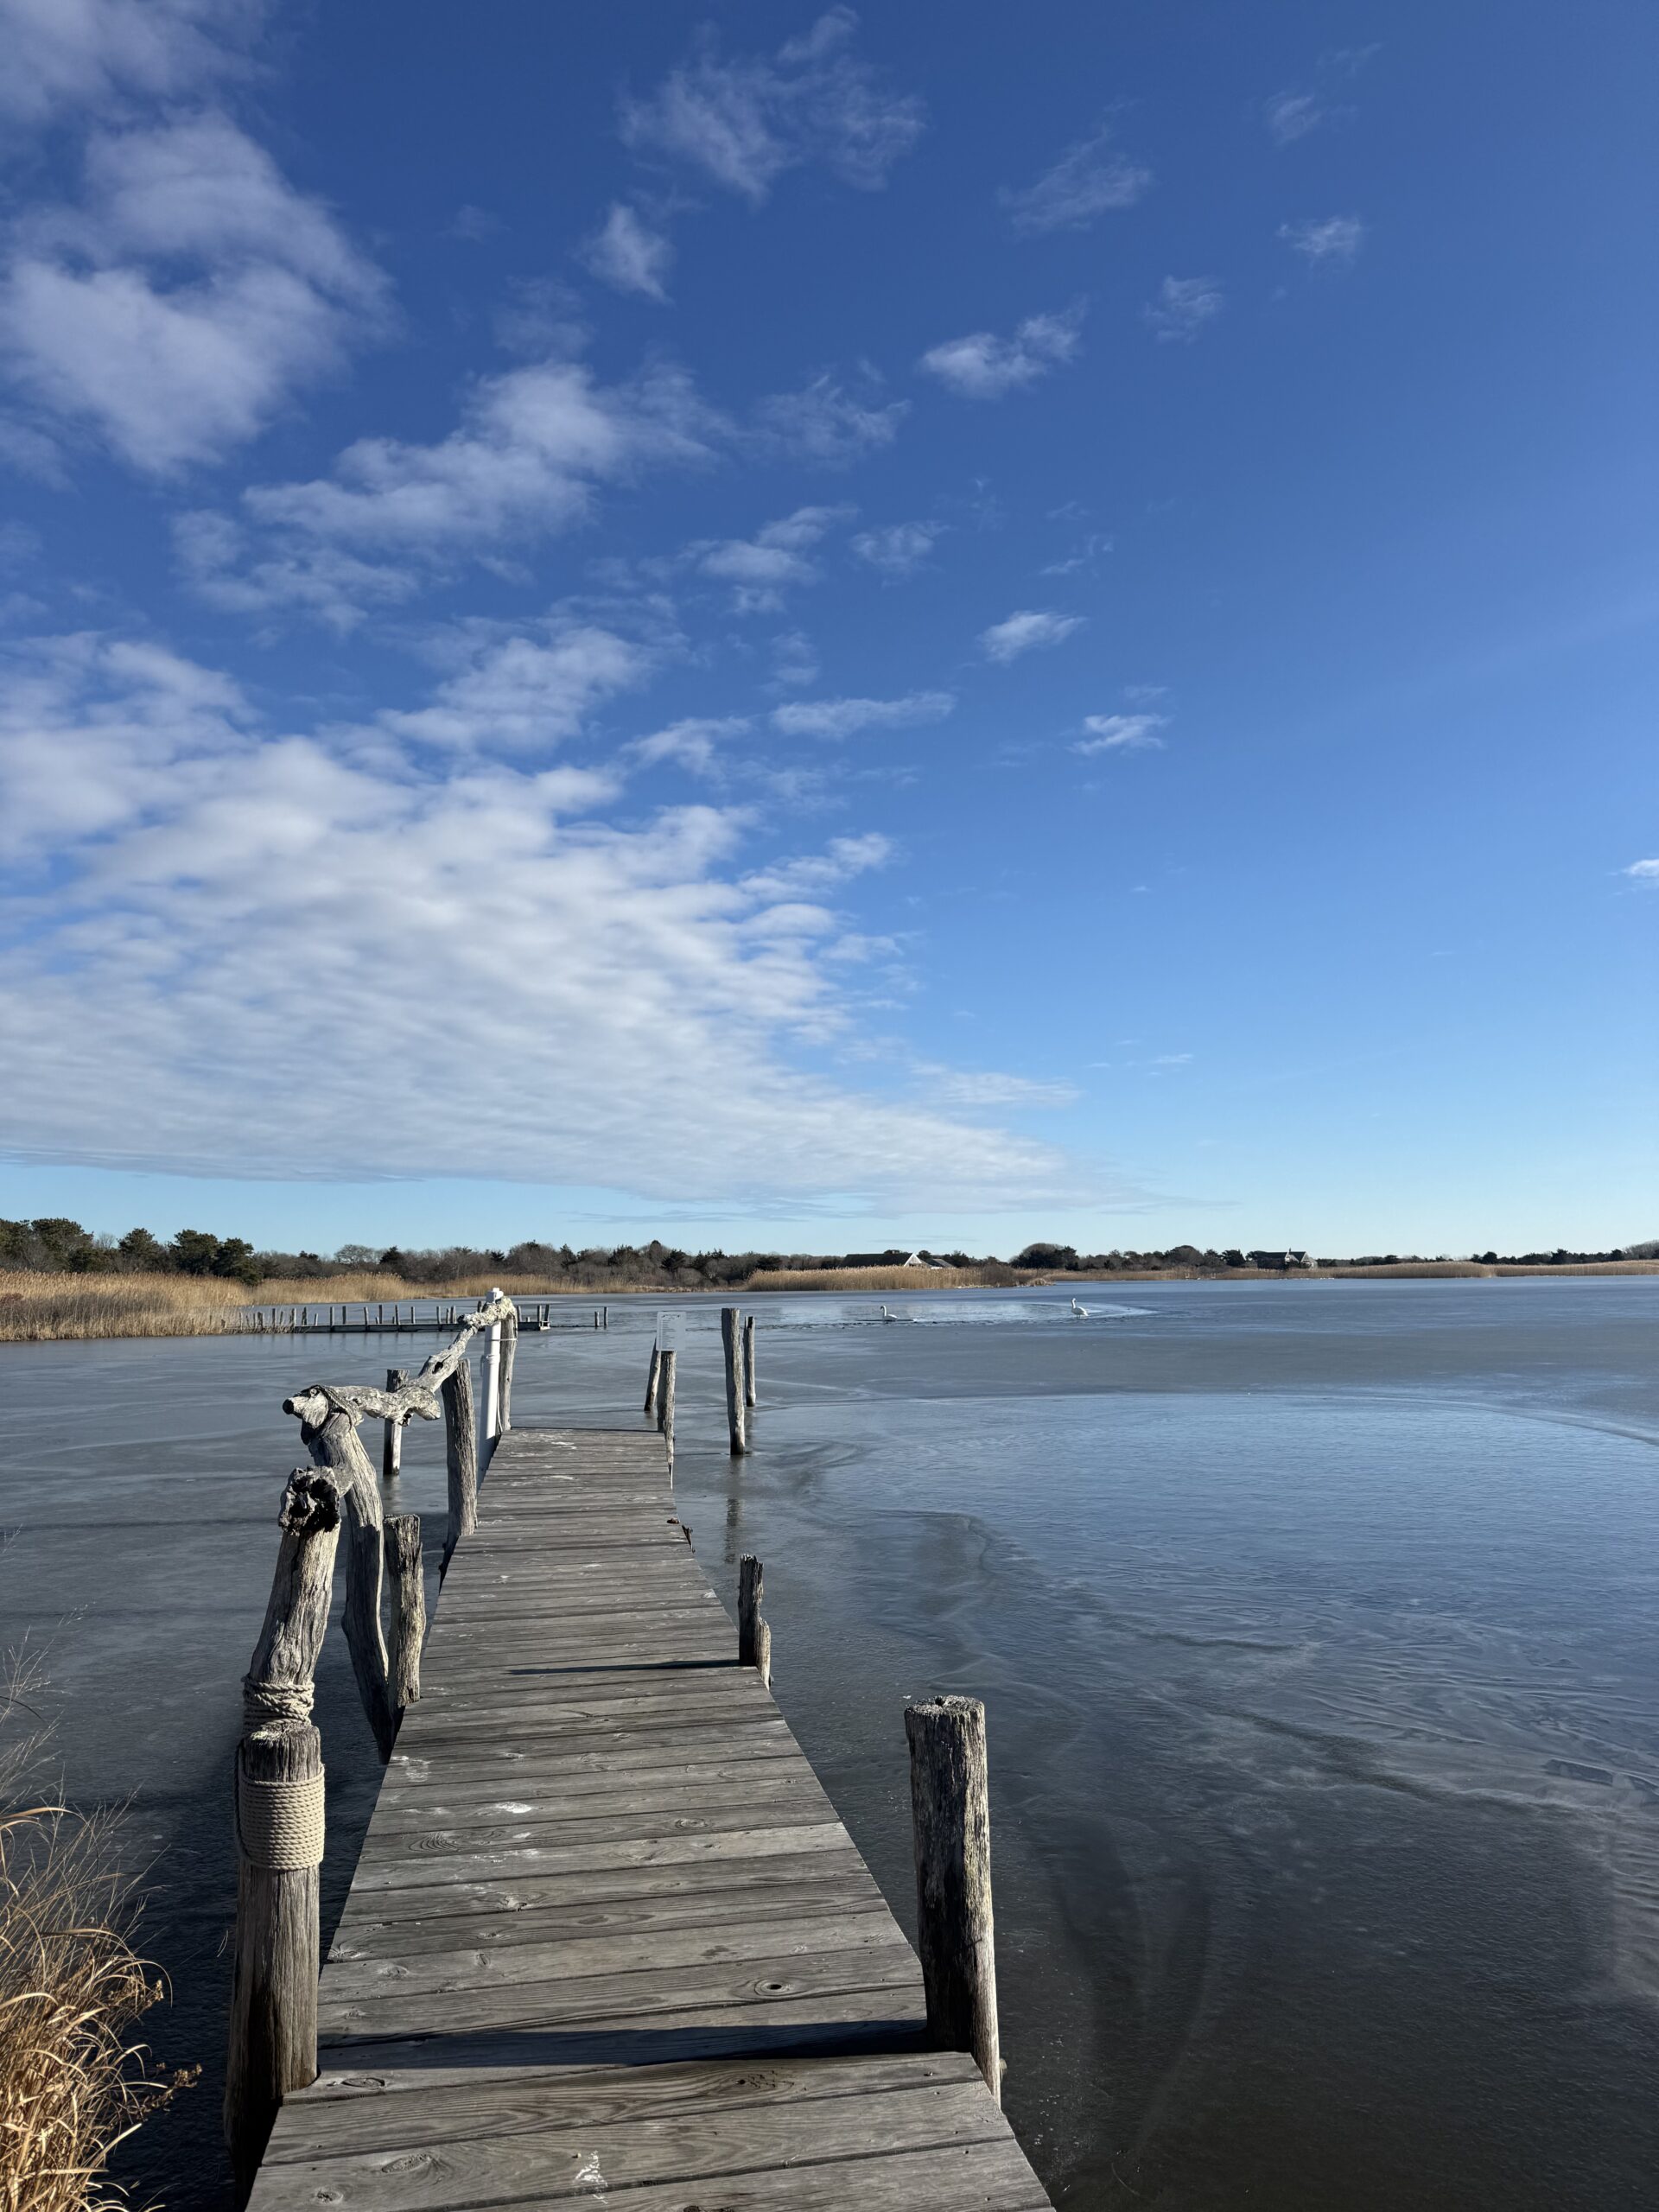
Even in the offseason, our science team is hard at work collecting critical data from our coastal ponds.
Last week, the team headed out to Edgartown Great Pond, Chilmark Pond, and Tisbury Great Pond to offload data from our pond elevation loggers, instruments that continuously record water levels year-round.
About The Loggers
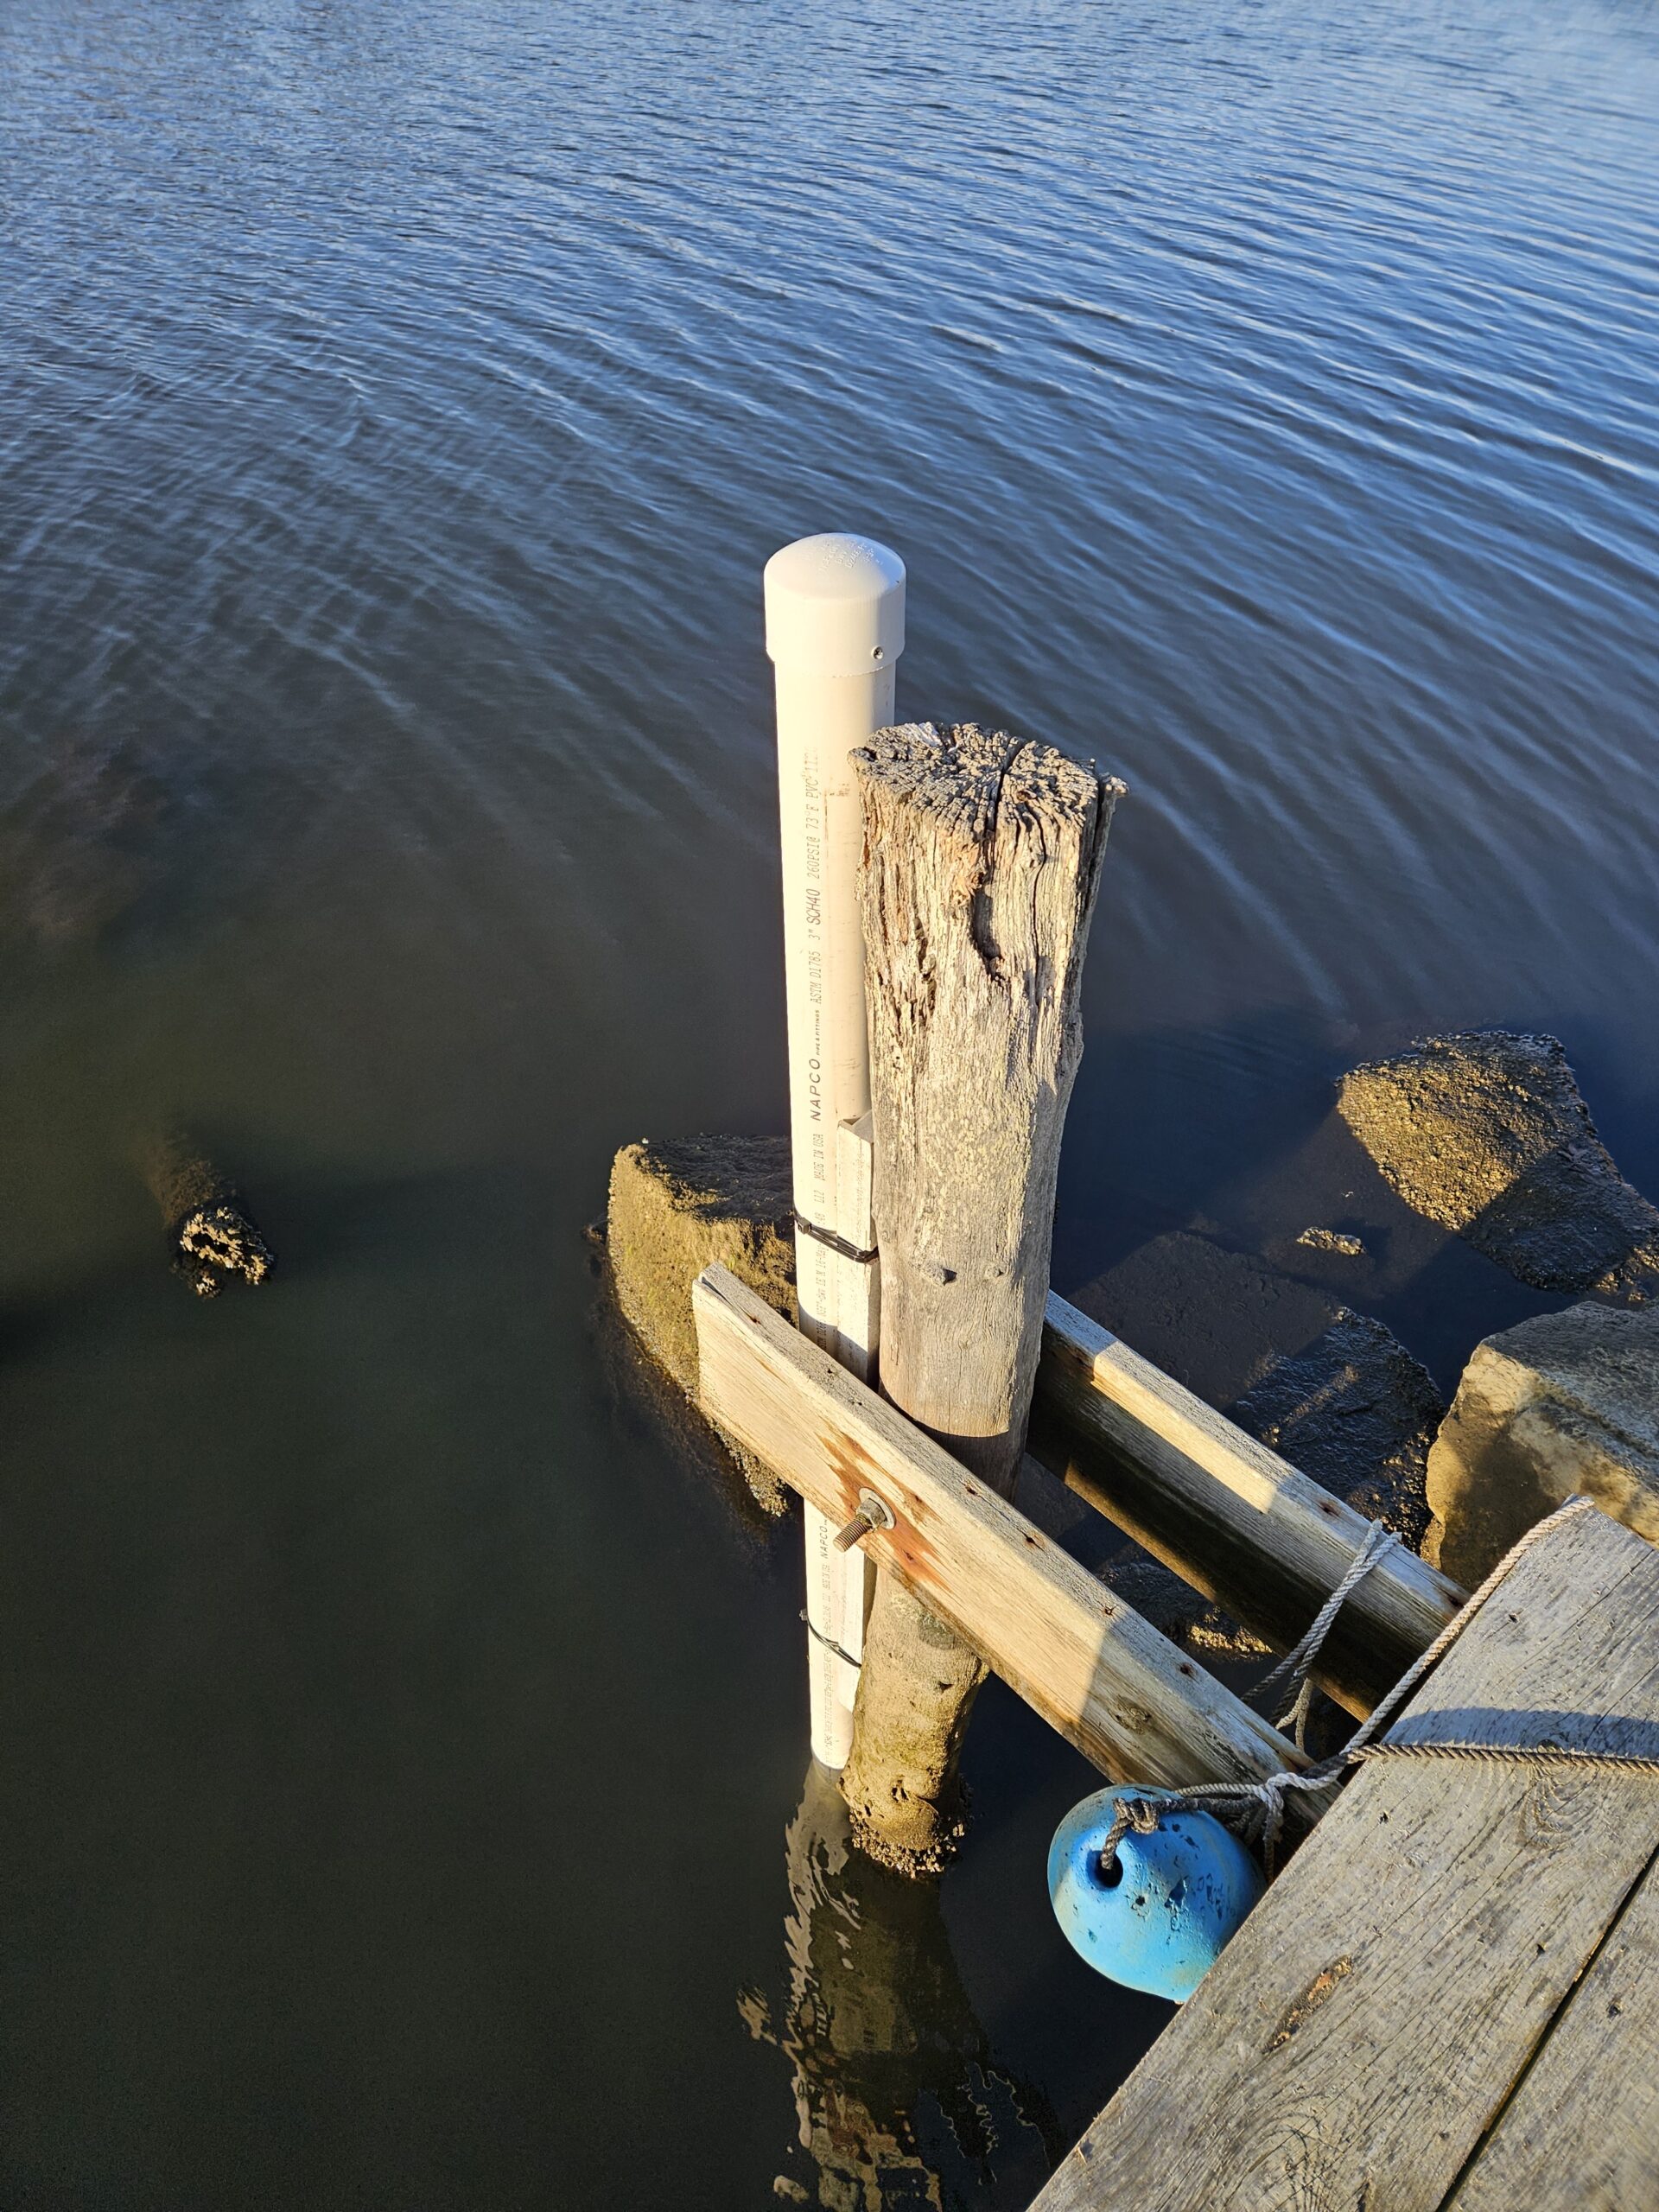
Each elevation logger is housed in a protective PVC casing and secured to a fixed structure. A long cable extends from the logger top, allowing the sensor end to be deployed directly in the water, where it records changes in pond elevation over time.
These loggers collect data every 30 minutes, allowing us to monitor pond elevation relative to sea level (NAVD88 reference). Pond elevation is reported in feet above Local Mean Sea Level (LMSL). When offloading each logger, the team performs a calibration check by taking a hand measurement to ensure the logger’s readings are accurate.
Importance
This data plays a crucial role in helping pond managers understand when to “cut” a pond open to the ocean, as well as how each pond fluctuates during and after am opening, evaluating its drain cycle and recharge time. Together, these insights help our community better understand pond dynamics and overall ecosystem health, supporting informed management decisions about pond water quality and health.
Explore the Elevation Data! (click on the arrow)
▶Edgartown Great Pond
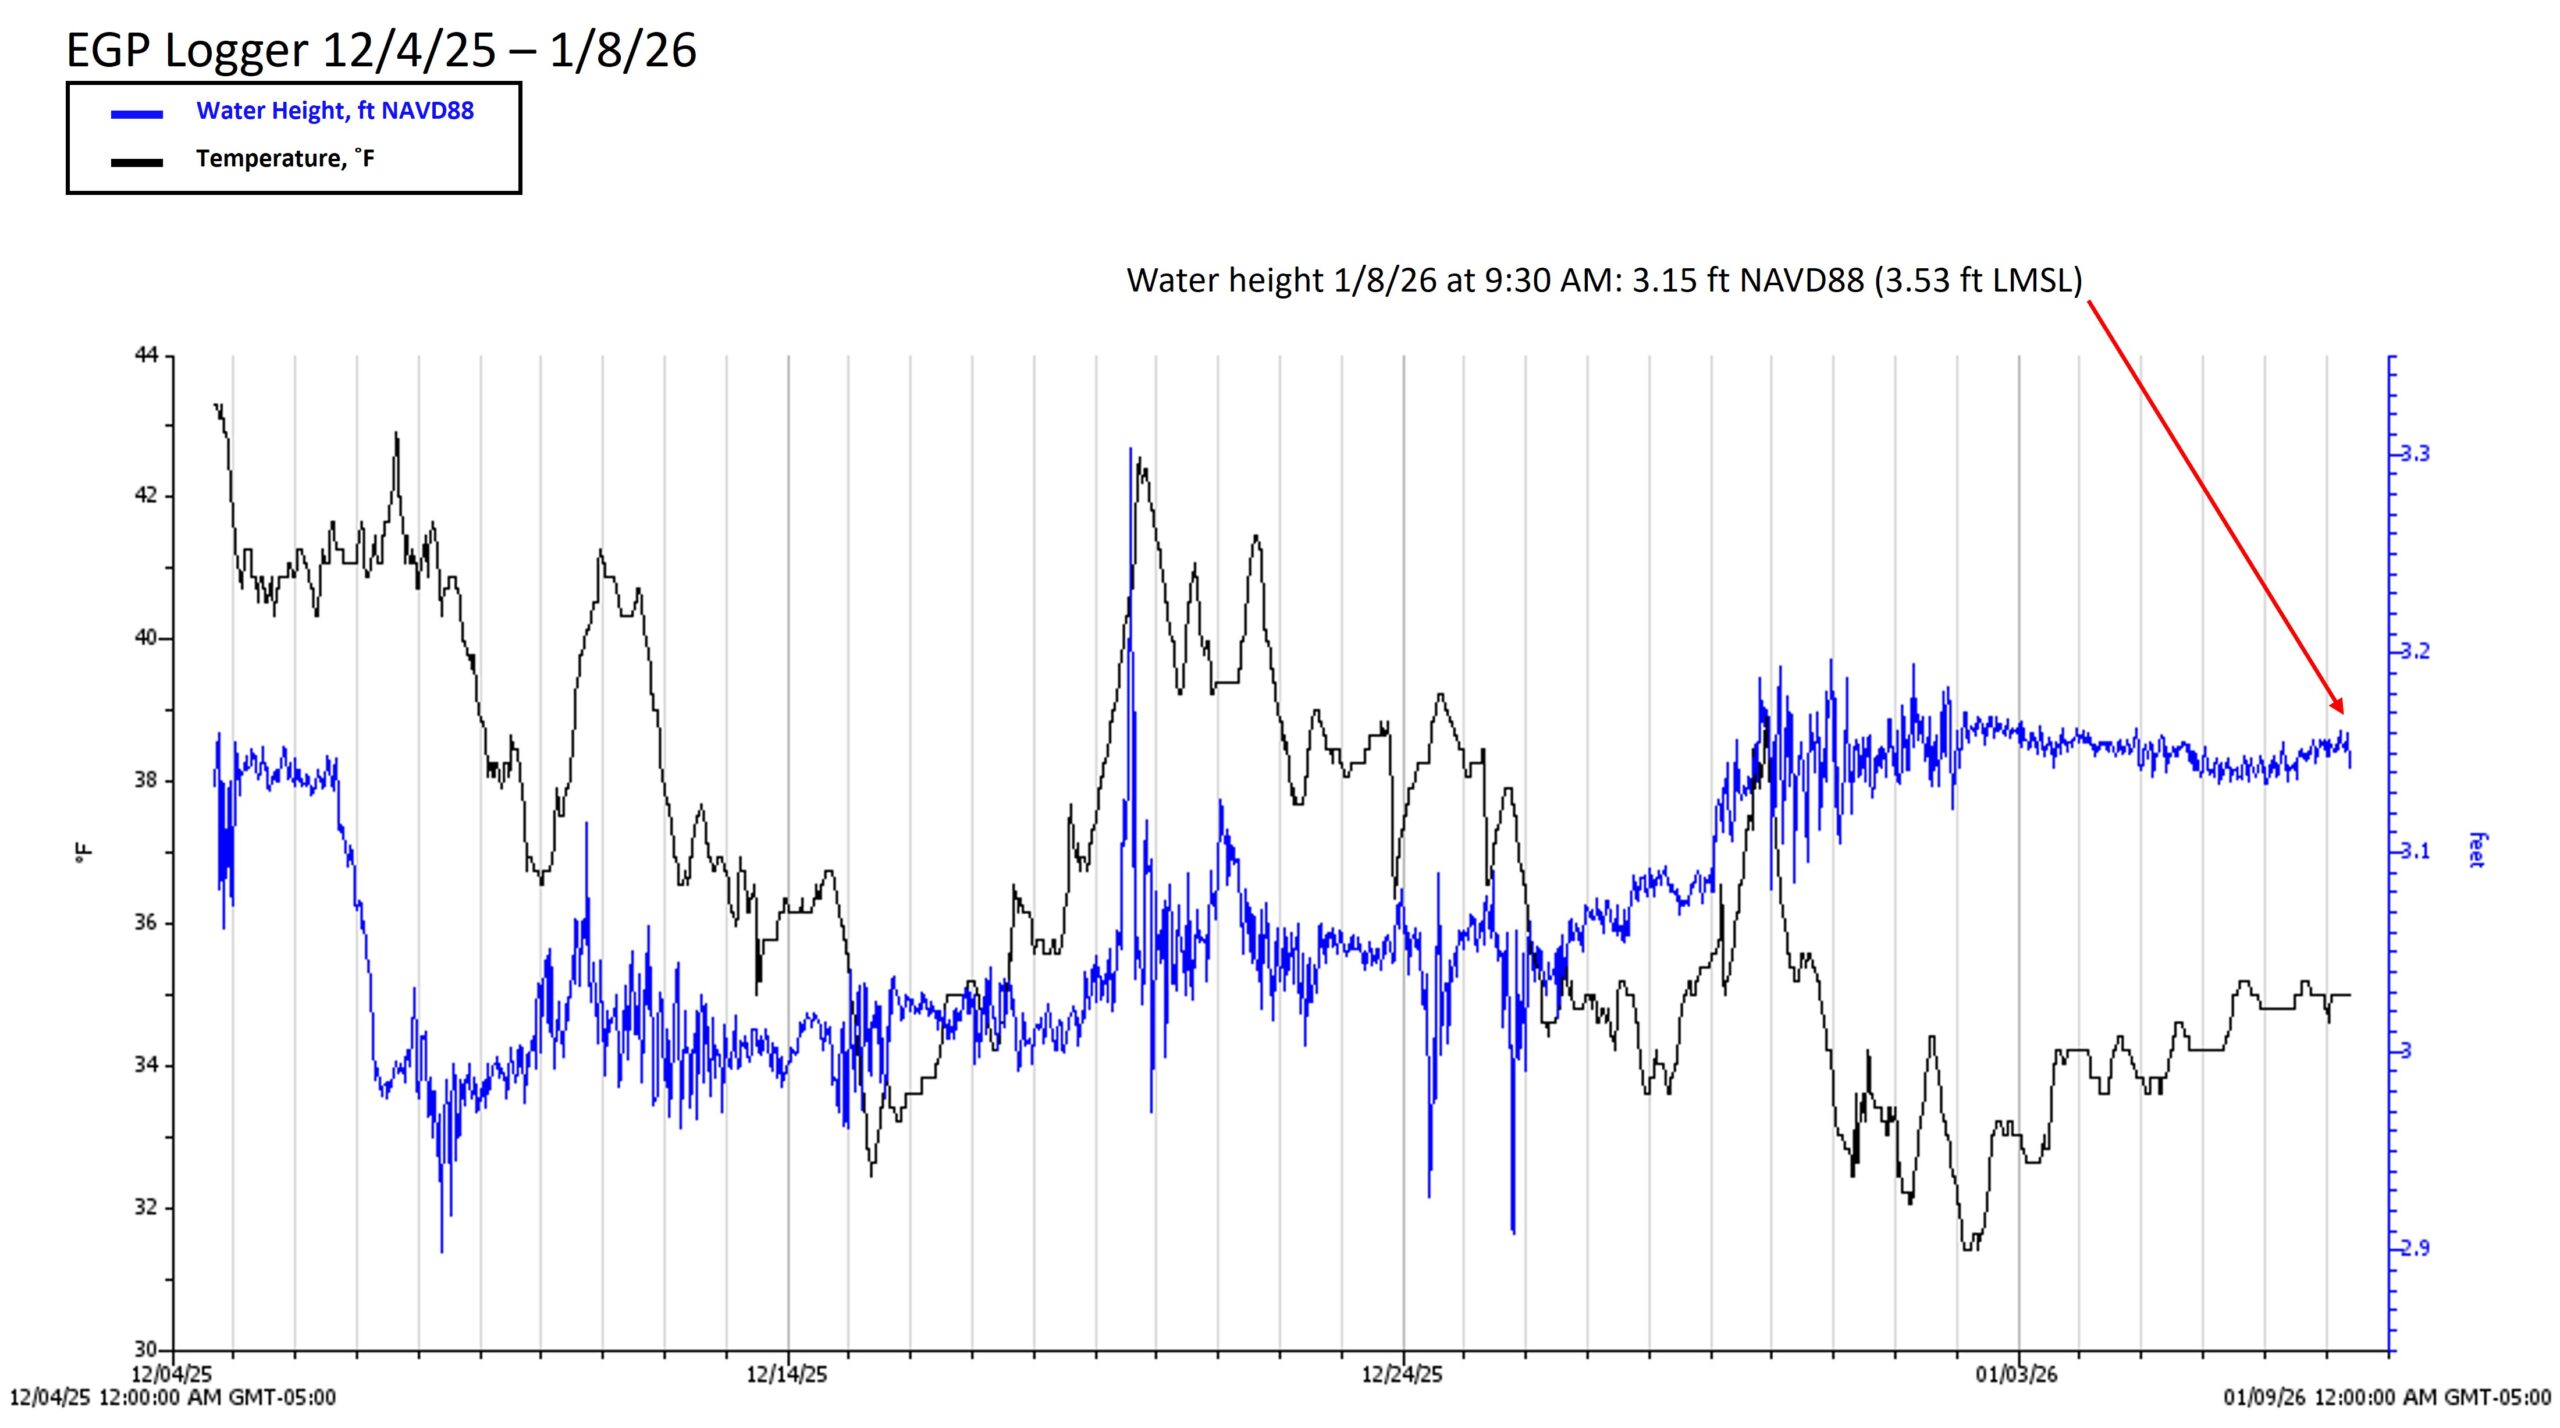
Figure 1: Readout of Edgartown Great Pond elevation data relative to NAVD88 from December 4th 2025 to January 8th 2026. Blue line representing elevation and black line representing water temperature. The pond’s latest elevation (on 1/8/26) was recorded at 3.53 feet above local mean sea level.
▶Chilmark Pond
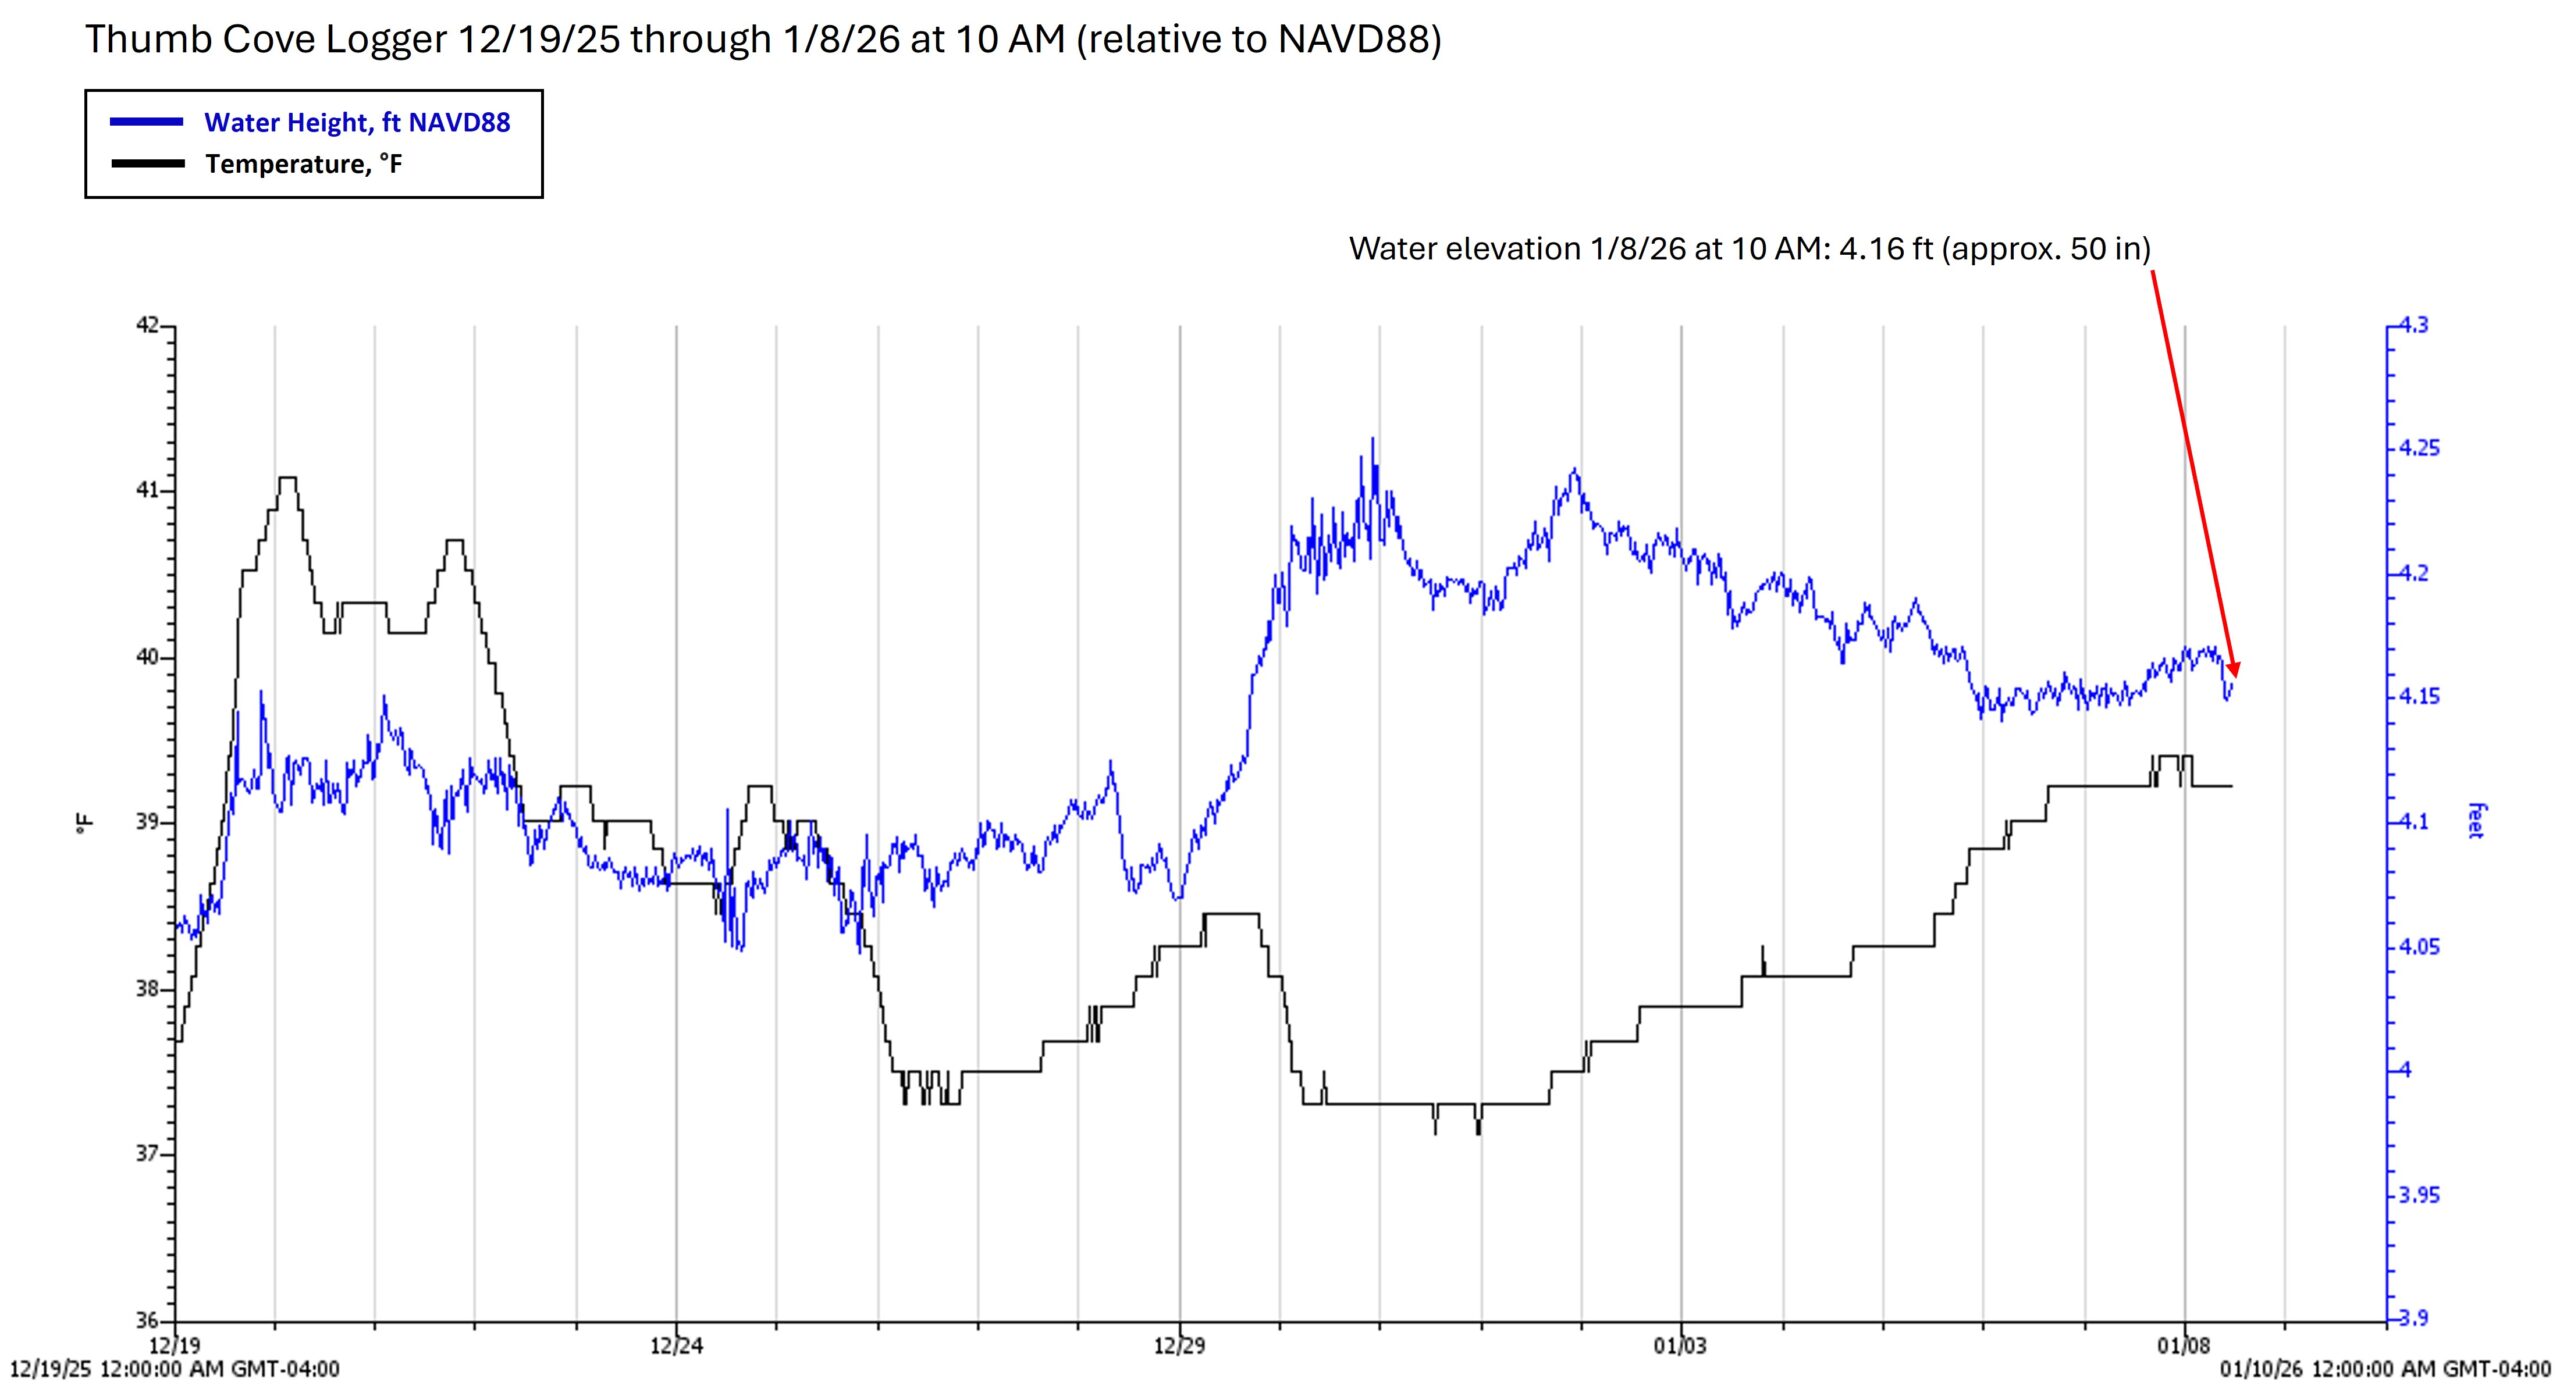
Figure 2: Readout of Chilmark Pond elevation data relative to NAVD88 from December 19th 2025 to January 8th 2026. Blue line representing elevation and black line representing water temperature. The pond’s latest elevation (on 1/8/26) was recorded at 4.54 feet above local mean sea level.
Over the past 2 months, the Pond has remained at a similar height, staying between about 4.38 and 4.68 feet LMSL since early November. Each notable rainstorm in the recent weeks has been followed by a period of relatively little rainfall, allowing the Pond to drop back down in elevation.
▶Tisbury Great Pond
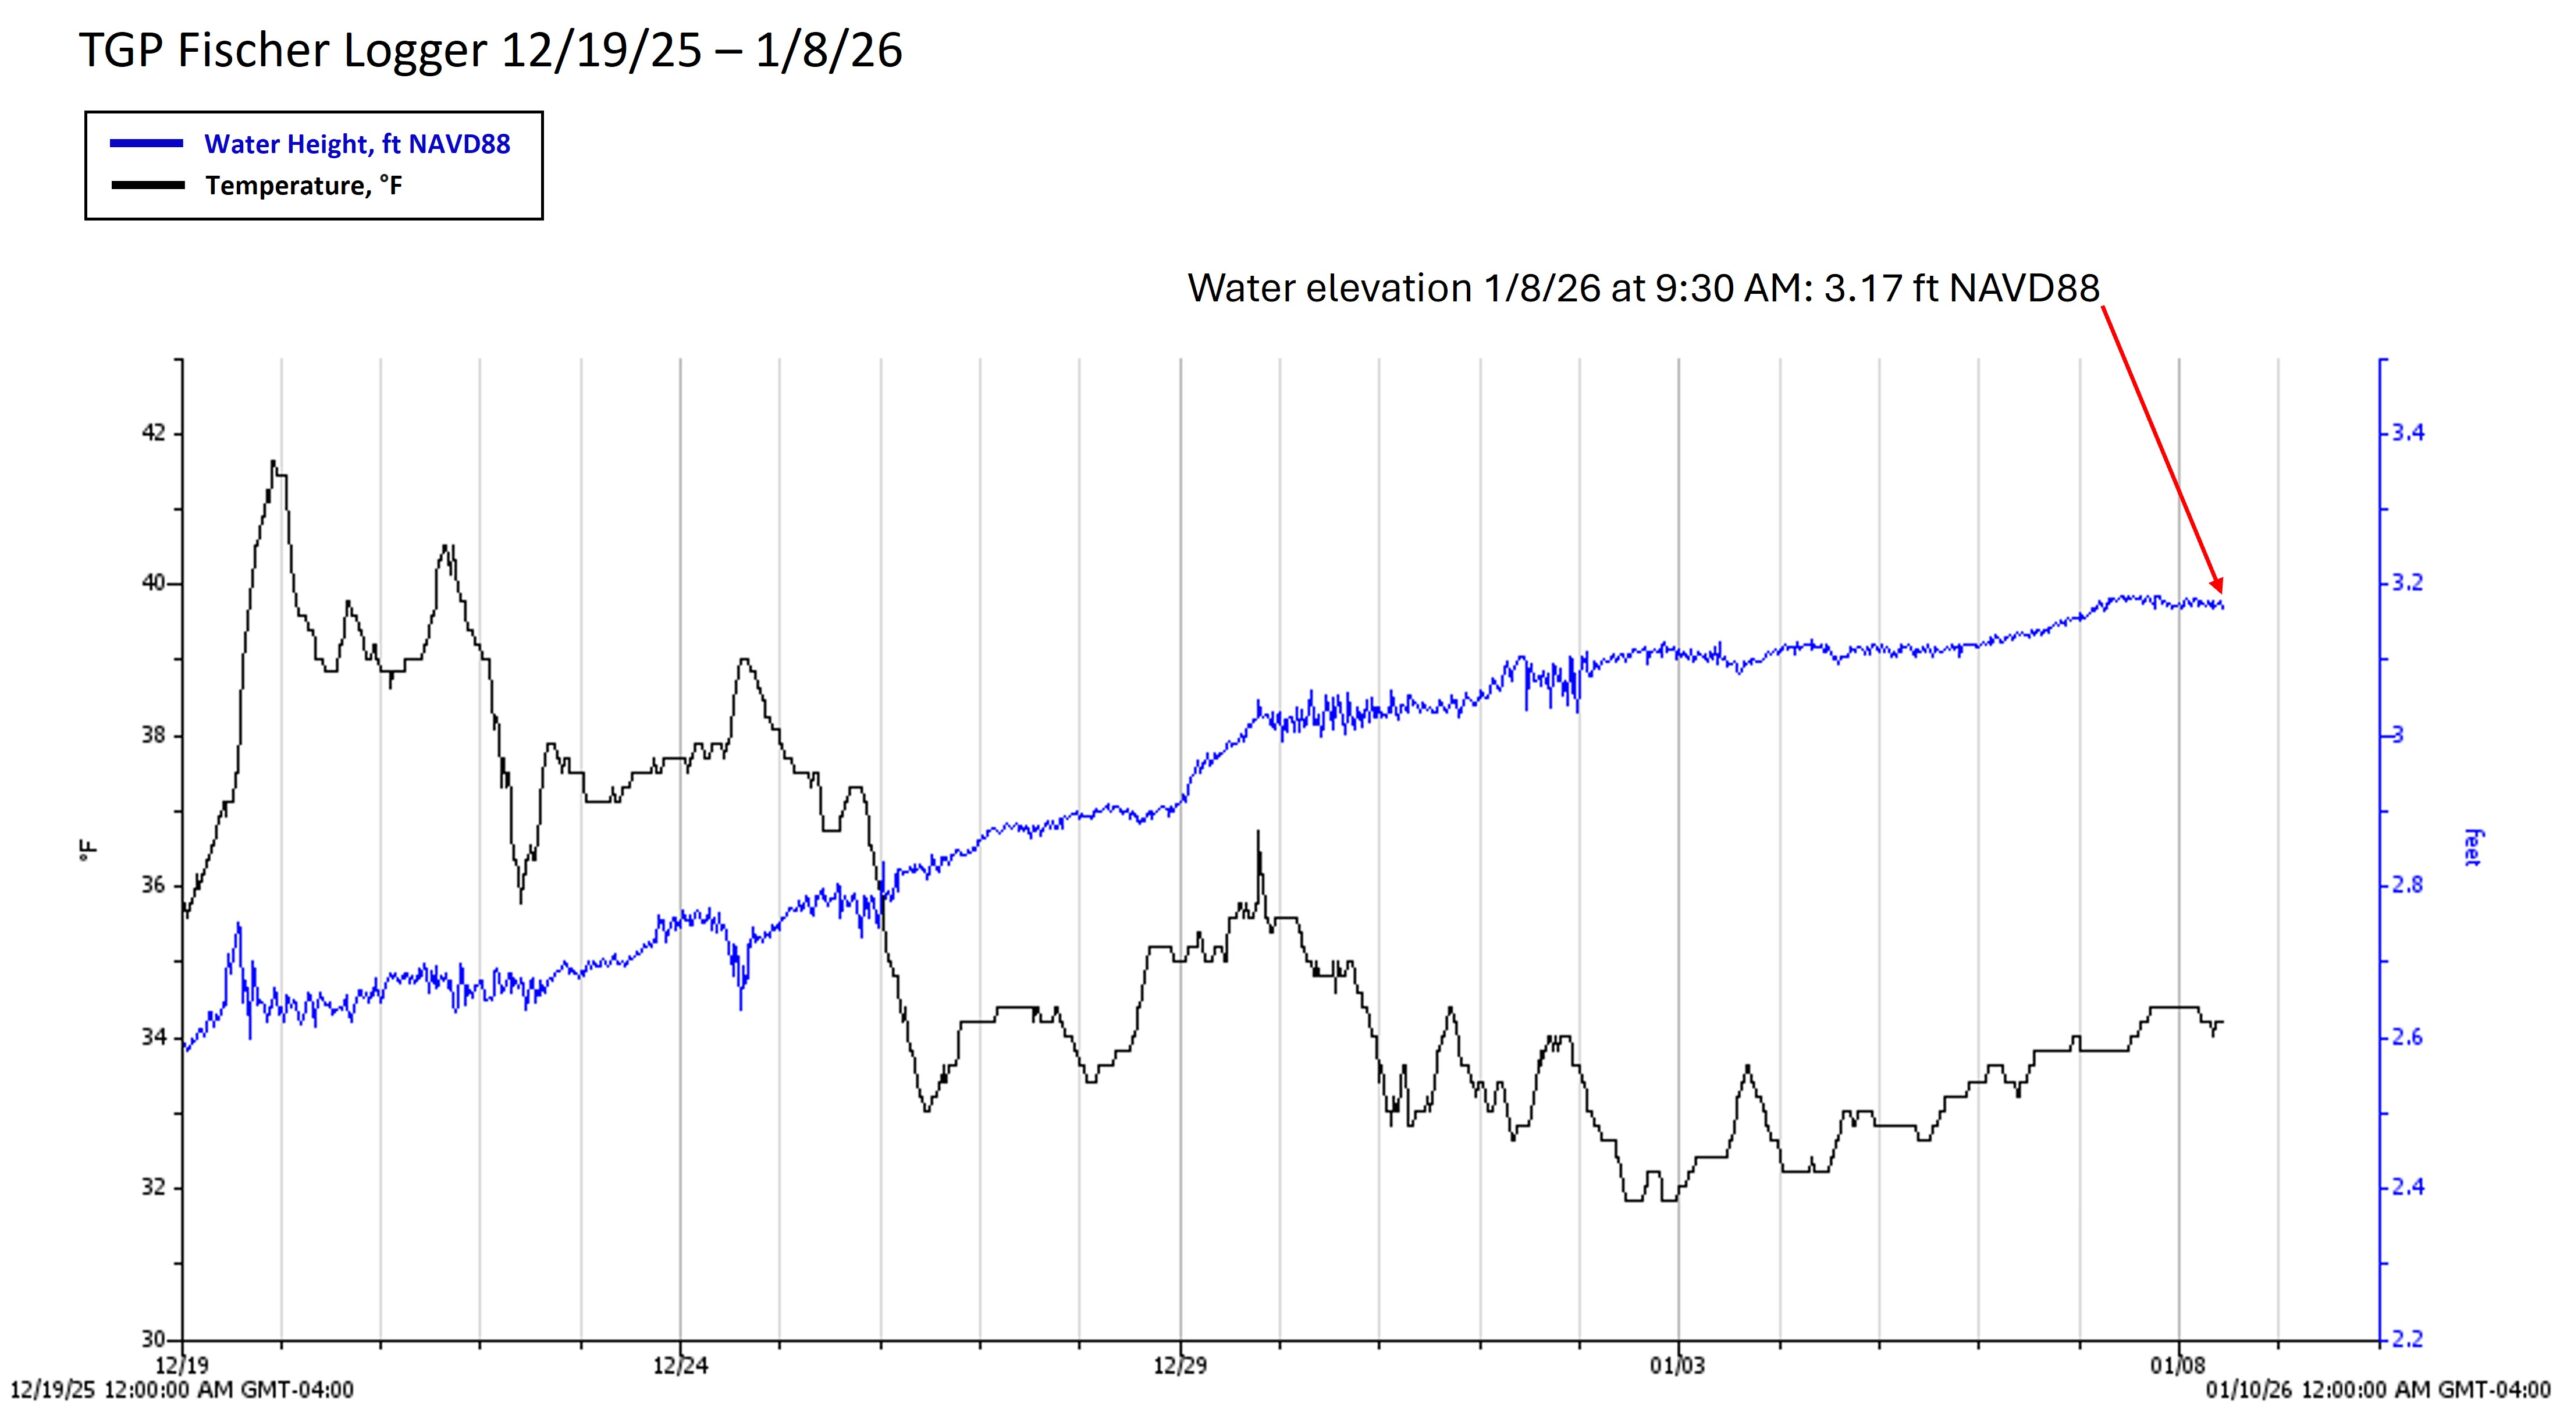
Figure 3: Readout of Tisbury Great Pond elevation data relative to NAVD88 from December 10th 2025 to January 8th 2026. Blue line representing elevation and black line representing water temperature. The pond’s latest elevation (on 1/8/26) was recorded at 3.55 feet above local mean sea level.