Water Quality Monitoring
What parameters are monitored?
The 12 water sampling stations where GPF collects data. EGP12 and EGP13 were added in 2018.
Dissolved Oxygen (DO): the amount of oxygen dissolved in the water, measured in milligrams per liter (mg/L). Organisms require adequate oxygen concentrations for their metabolism and will become stressed if DO becomes depleted. The management goal for a healthy pond is 6 mg/L. DO levels below 4 mg/L are when organisms begin to suffer from lack of oxygen, and when DO drops below 2 mg/L the water becomes hypoxic, where oxygen deficiencies can be fatal. The amount of oxygen that can physically dissolve in water is dependent on temperature, salinity and pressure.
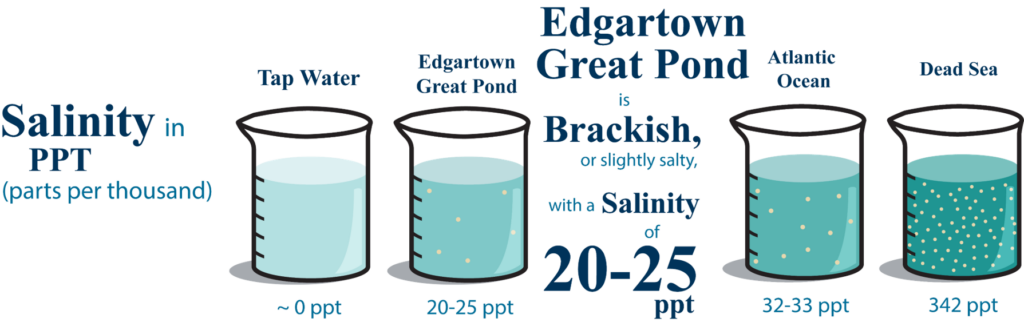
Salinity: the amount of salts dissolved in the water, measured in parts per thousand (ppt). Ocean water has a salinity of 32-35 ppt, while freshwater is 0 ppt. Most organisms are adapted to live in either freshwater or saltwater and cannot tolerate both. The GPF management threshold is 15 ppt, which is the lowest salinity in which eelgrass can survive.
pH: a measurement of how acidic or basic a solution is. Neutral pH is 7. pH of coastal waters often range from 6.5-8.5, which is the management goal. pH will often become acidic if there is excessive decaying organic matter in the water or sediment.
Turbidity: a measure how many particles are dissolved in the water, which affects how much light is transmitted through the water column. Water with low turbidity is clear and you can often see the bottom, while water with high turbidity appears murky. High turbidity is detrimental to submerged aquatic vegetation, as less sunlight can penetrate the water.
Chlorophyll: Chlorophyll is a pigment plants use for photosynthesis, measured in micrograms per liter (µg/L). Monitoring chlorophyll concentrations can tell you if excessive plant growth is occurring, such as an algal bloom. The management goal for chlorophyll is 3-10 µg/L.
Nutrient Concentrations: Dissolved concentrations of nitrate, phosphate, silica, and ammonium, measured in milligram/liter (mg/L). Living organisms need these nutrients to survive, however they are often elevated in coastal waters. Elevated nutrient levels usually come from fertilizer and septic systems, and lead to excessive plant growth and deteriorated water quality, a process called eutrophication. In EGP, nitrate and ammonium have been elevated in the past and are monitored closely, with a management goal of keeping total nitrogen (TN) to 0.5 mg/L of nitrogen or less.
What is a healthy pond?

DO is produced by plants and consumed by animals. Illustration by John Holladay.
Healthy coastal ponds have clean water, clean sediment, and a high diversity of plants and animals. Eelgrass (Zostera marina) is often used as an indicator species, as it can only survive in ecosystems with excellent water quality. GPF uses these water quality guidelines from the Massachusetts Estuaries Project (MEP) and EPA:
℘Dissolved O2 ≥ 6.0 mg/L
℘pH 6.5-8.5
℘Temperature ≤ 85°F
℘Transparency 1.5 – 3.0 m (or bottom, if <3 m)
℘Total nitrogen 0.28 – 0.61 mg N/L
℘Chlorophyll-a pigments 3-10 μg/L
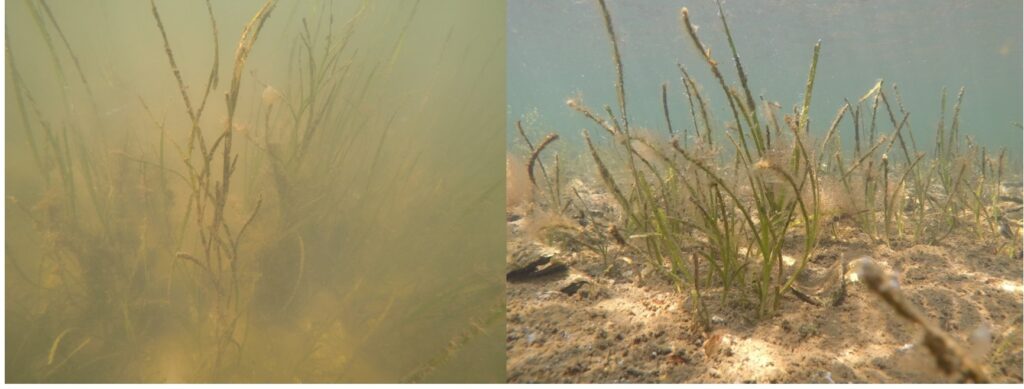
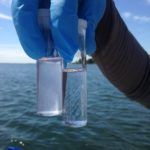
Highly turbid water is murky with low transparency (image on left), while water with low turbidity is clear (right).
How and Why is the GPF monitoring EGP?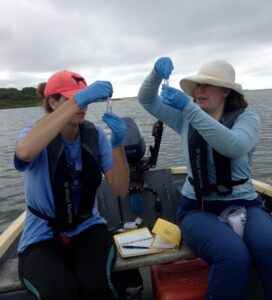
In the spring of 2016 GPF purchased state of the art equipment so that we can assess Pond health and create a database of high quality water quality data over time. We sample at 12 stations around the Pond twice weekly during the summer. High resolution sampling allows us to observe trends and identify any potential anomalies before they become detrimental. By having scientific grade equipment in house, the Foundation has the ability to answer site-specific and time-dependent questions. We are interested in how water quality varies throughout different regions of the Pond, throughout the seasons, and in response to Pond openings.
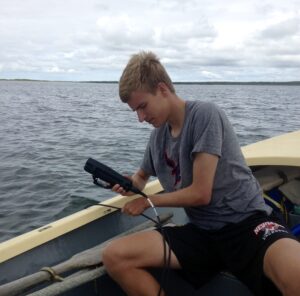 We use a handheld probe called a CTD (Conductivity Temperature Depth) from YSI called the ProDSS Multiparameter Sampling Instrument. This device measures all the parameters mentioned above, plus many more. We also have a device called a photometer which measures nutrient concentrations. We are primarily measure ammonium, nitrate, phosphate, and silicate, but have the ability to measure many other nutrients with this device, should they be of interest.
Check out these videos of former interns explaining how we collect data!
Frequently asked questions:
What is eutrophication?
Eutrophication is the build up of excess of nutrients in a pond or lake. The presence of these nutrients can stimulate a rapid and extensive growth of phytoplankton. This rapid growth or “bloom” can in turn deplete the oxygen from the water causing local hypoxia (oxygen poor ) or even anoxic (oxygen free) regions. Most plants and animals need oxygen to live, so this depletion of oxygen can be devastating to the ecosystem.
Where do these nutrients come from?
Nitrogen and Phosphorus are the most commonly measured nutrients because of their role in phytoplankton growth. Nitrogen enters a pond system through rainwater, decomposition of biological mater, animal waste, septic sources, or fertilizer. Phosphorus is a component of both fertilizer and detergents. In systems where Nitrogen and Phosphorus are not limiting factors, Silicates can be the limiting nutrient for phytoplankton growth. Most Silica comes from the weathering of rocks.
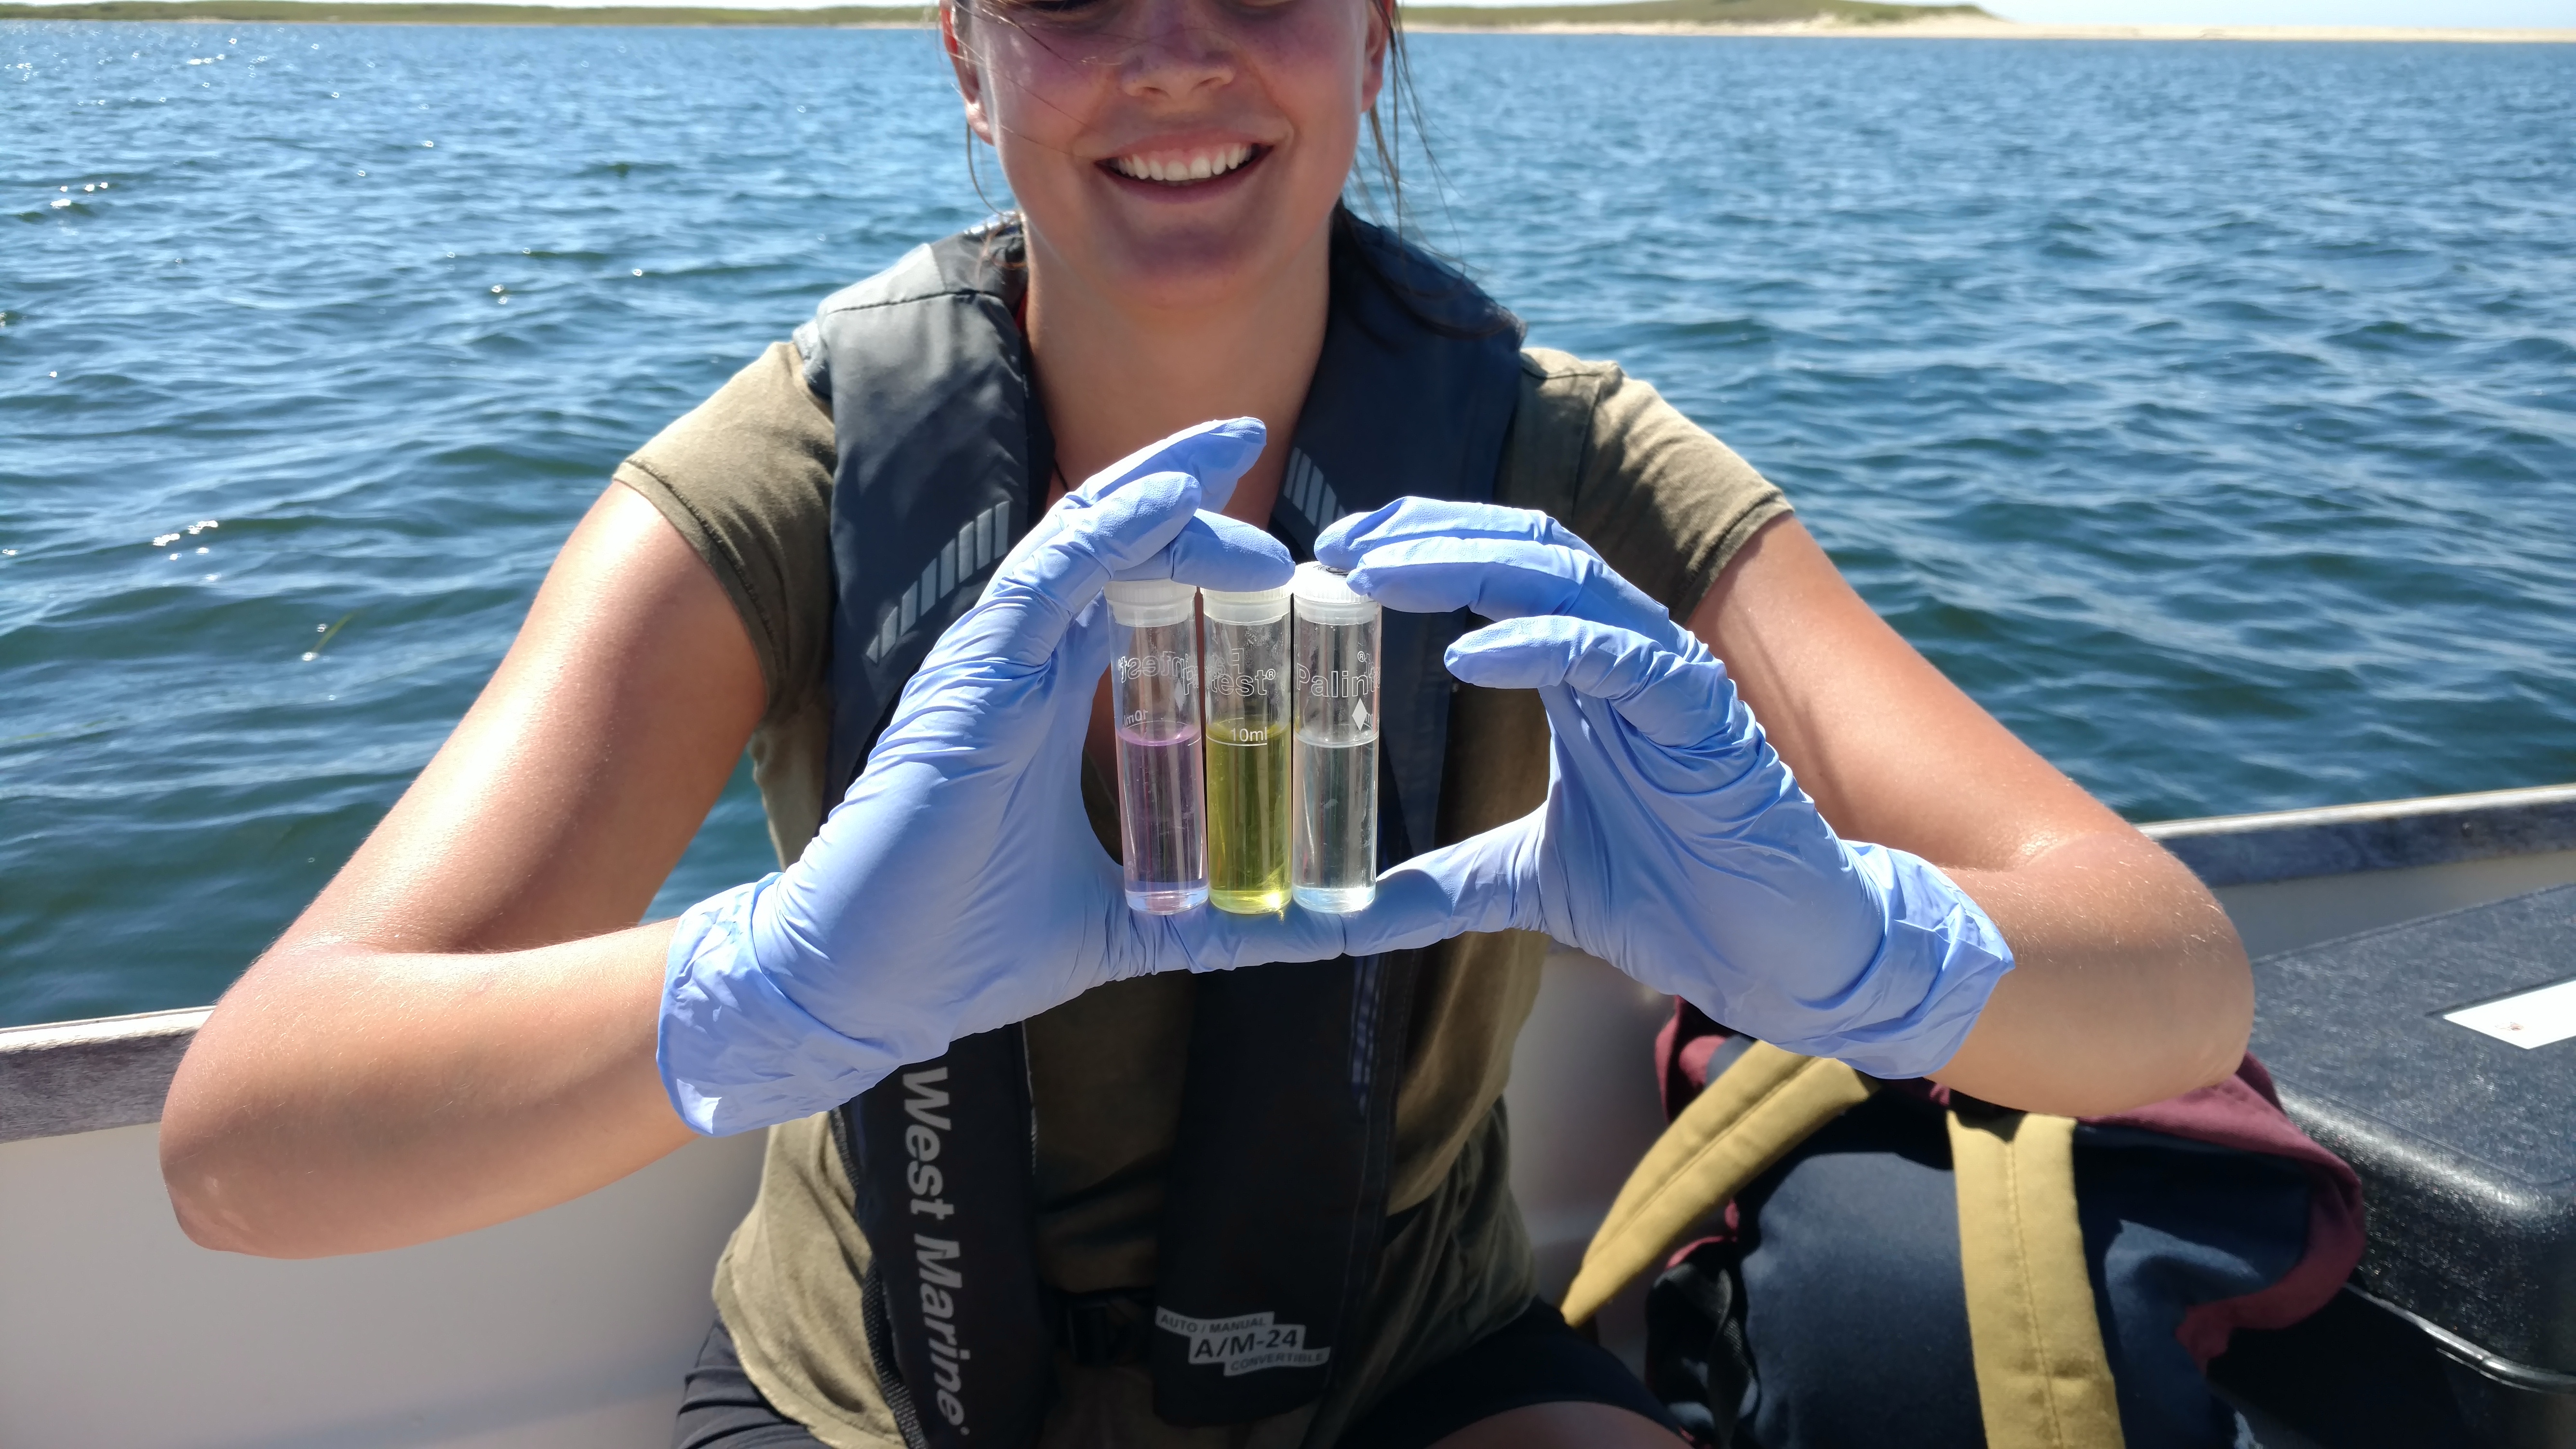
What is a Photometer and how does it work?
 A Photometer works by passing light of a specific wavelength through a solution to measure the intensity of color. This color develops as a result of a chemical reaction. We add reagents to Pond water and these reagents react with the nutrient in question and produce a color. It is important to measure a clear solution to prevent a falsely elevated reading due to precipitates in the solution.